
This article mainly introduces seven little-known small functions of Visual Studio Debugger in detail, which has certain reference value. Interested friends can refer to it
Visual Studio debugger is a Great debugging tools that can help programmers quickly find and solve problems. Here is a brief introduction to seven little-known functions in the VS debugging tool.
1. Jump to the specified statement with one click
During debugging, you often need to drag the yellow arrow to execute or not execute a specific statement. The conventional method is to use the mouse to drag directly.
In the Visual Studio 2017 15.3 preview version, there is a simpler way to jump to the target row: hover the mouse pointer on the target row, and when the green vertical line right arrow icon appears, hold down CTRL and click the mouse left Click the button to move the debugging yellow arrow, and then click Debugging Next or F5 to run directly on the specified line.


2. Add a breakpoint for the specified instance value
Sometimes the attribute value of an instance will change inexplicably. When we need to know why it changes, we will add a breakpoint in the attribute code, but this will take effect on all instances.
When debugging, you can use the Make Object ID and Conditional Breakpoint functions to add breakpoints for specified instances, as follows:
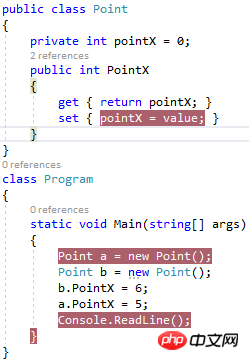
First I defined a class, And initialized two objects, changed the value of PointX, and wanted to add a change breakpoint of the PointX value of instance a
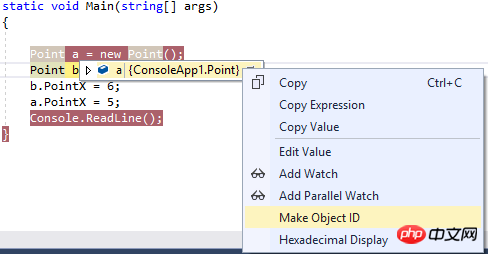
During the debugging process, Right-click instance a and select Make Object ID
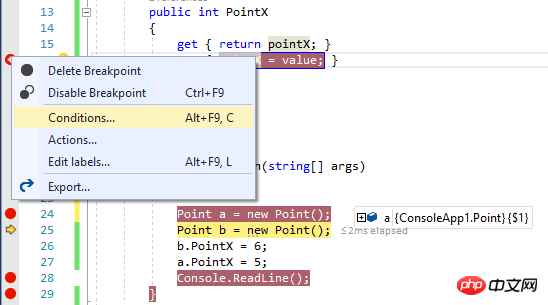
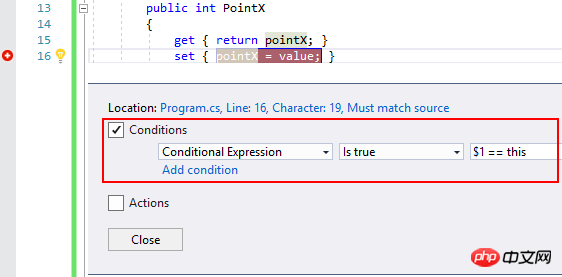
3. Reattach process
Attach to Process is a function that everyone often needs to use. There is a new option in Visual Studio 2017 called Reattach to Process, which can be convenient Everyone reattaches to the process they were last attached to. First attach to a process, click Stop Debugging, and then click Debug to see the Reattach to Process option inside.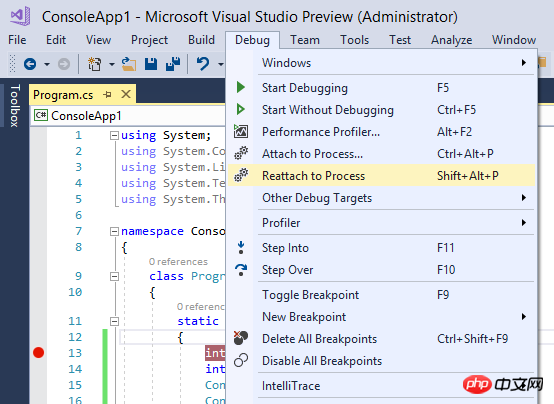
4. Show all threads
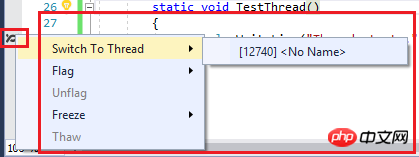
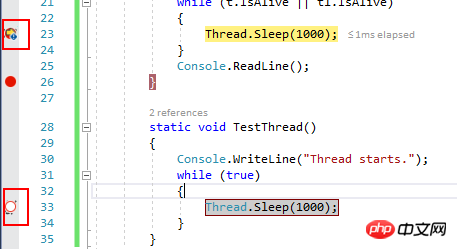
During the debugging process, there is a new option in the debugging toolbar called: Show Threads in Source. After clicking, an icon will be displayed in front of the line of code where the thread is stopped. When the mouse stays on the icon, the thread will be displayed. Right-click the icon to display the available operations.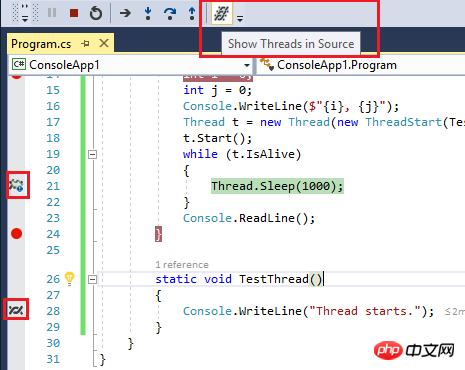
5. Temporarily disable specified breakpoints
When performing multi-thread debugging, you can use the Disable Breakpoint function to temporarily disable specified breakpoints to prevent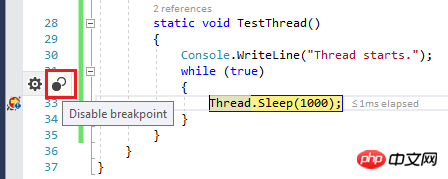
6. View the call stacks of all threads
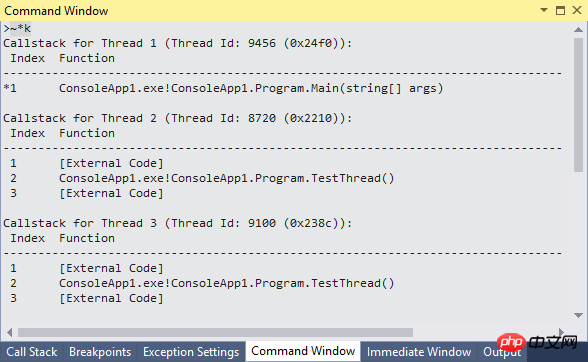
During debugging, in Command Enter "Debug.ListCallStack -AllThreads" in Window to see the call stacks of all threads.
7. No negative effects when used Method evaluation
Sometimes you may need to view the return value of a method in the debugging Watch window, but when this method is actually executed, it may have negative effects. Here you can add ", nse" when inputting in the Watch window to avoid negative effects. It is the abbreviation of "No Side Effects". The example is as follows:
Add was executed six times at the beginning, so the total number of testList is 6.
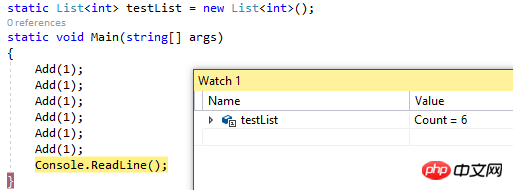
Now if you want to view the return value of Add’s current execution, you can Enter Add(1) in the Watch window, but this will have a negative impact, changing the value of testList to 7,
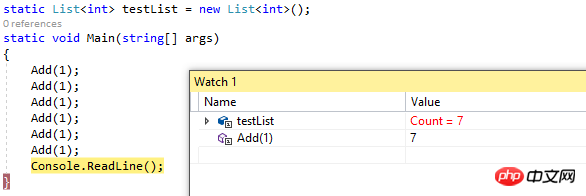
So if you want not to affect the original value of testList, you need to add On ", nse", the following display is 8, but the original value of testList has not changed and is still 7:

The introduction ends here. Do you have any small debugging functions you like? Welcome Come and comment~
PS: It’s just an introduction, don’t comment if you don’t like it.
The above is the detailed content of Little features you don't know about in Visual Studio Debugger. For more information, please follow other related articles on the PHP Chinese website!


