Example tutorials for common functions of Chrome DevTools
Google Chrome is now the most popular web browser used by web developers. With a six-week release cycle and ever-expanding powerful development features, Chrome has become a must-master tool. Most front-end developers are probably familiar with many of Chrome's features, such as using the console and debugger to edit CSS online. In this article, we’ll share 15 cool tips that will allow you to improve your workflow. After reading these techniques, you will be surprised and excited to find out how much they look like Sublime Text.
1 Description
This article conducts research and analysis on common functions of Chrome DevTools. Describes the functions, application scenarios and detailed operations that each function point can implement.
2 Elements
2.1 Function
Check and update the HTML and CSS# of the page in real time
Inspect and live edit any element in the DOM tree in the Elements panel.
View and change the CSS rules applied to any selected element in the Styles pane.
View and modify the box model of the selected element in the Computed pane.
2.2 Application scenarios
Editing DOM nodes during development
DebuggingStyle of DOM nodes
Check and edit box model parameters during debugging
2.3 Operation
EditDOM node
- ##
Open control Desk, select the DOM node that needs to be modified, double-click the selected element, and then modify it.
- Edit style
Open the console and select For the DOM node that needs to be modified, edit the style attribute name and value in real time in the Styles pane. All styles can be modified except the gray ones (same as the User Agent stylesheet).
To edit a name or value, click it, make the changes, and press Tab or Enter to save the changes. By default, your CSS modifications are not permanent and will be lost when the page is reloaded.
- Inspect and edit box model parameters
Use the Computed pane to inspect and edit the box of the current element model parameters. All values in the box model can be modified by clicking on them.
3 Console
3.1 Function
- Print log
- Execute test code
- Measurement and statistics execution
- Exception and error handling
3.2 Application scenario
- In the output page code Logs that need to be output
- You can test the code in the browser console
- Check the execution efficiency of the code
- Exception and error information in the output code
3.3.1 Common API:
- console.log() Output information
- console.info() Output information
- console.warn() Output warning information
- console.error() Output error information
- console.group() Output a group of information, It needs to be used with console.groupEnd() to use
- console.groupEnd() to output a set of information, and it needs to be used with console.gruop() to use
- console.time()
- To output the time of code execution, it needs to be matched with
console.timeEnd() Use
console.timeEnd() To output the time of code execution, it needs to be matched with console.time() use
4.1 Function
- Test network performance
- Analyze network requests
4.2 Application scenario
4.3 Operation
4.3.1 Record network request
By default, as long as Chrome DevTools is turned on, DevTools will record all network requests, and the records will be displayed in the Network panel.
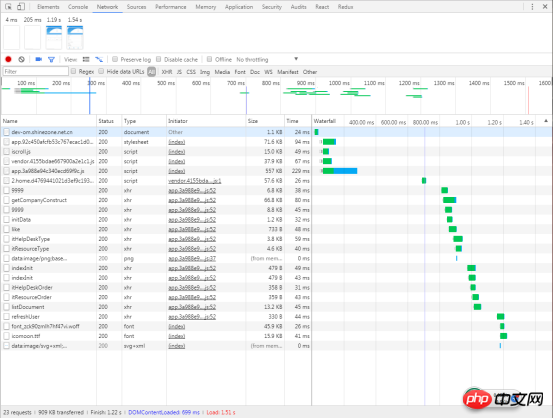
4.3.2 Stop recording network requests
ClickStop recording network log red icon, when it turns gray, it means DevTools is no longer logging requests
Shortcut keys: Under the Network panel, Command+E (Mac) or Ctrl +E(Windows,Linux)

##4.3.3 Clear network request

4.3.4 When loading across pages, keep network request records
When the page is reloaded or the page jumps, the default situation Next, the network request record table under the Network panel is also refreshed. If you want to retain the network request data of the previous page, you can check Preserve log.
A common application scenario: the login/registration API will be called when logging in/registering. The developer wants to check the situation returned by this interface, but the login/registration is successful. After that, it usually jumps to a new page, causing the request record of the Network panel to be refreshed and the return of the login/registration interface cannot be seen. At this time, if Preserve log is checked, no matter which page you jump to, you can view the status returned by the previous interface in the Network request record table.

4.3.5 Capture screenshot when page loads
- Capture screen Screenshots can analyze what the user sees on the web page at different times during the page loading process.
Click the Capture screenshots icon to turn on the capture function. When the icon turns blue, it means it is turned on. Reload the page to see screenshots at different times.

Hover the mouse When a picture is displayed, a yellow border will appear around the picture. At the same time, there will also be a yellow vertical line in the Overview and Waterfall windows respectively. This yellow vertical line indicates the capture time of this picture.
Click on a picture to filter out all requests that occurred after this picture was captured- Double-click the picture to enlarge the picture
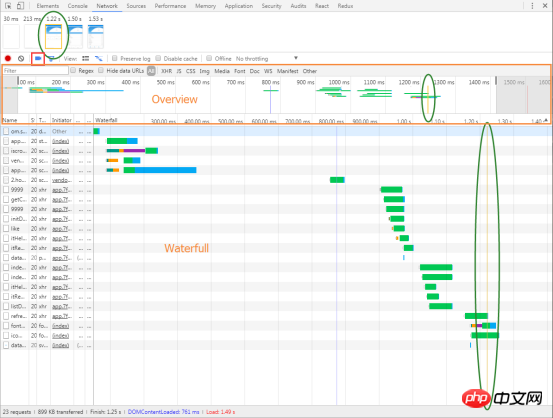
4.3.6 Disable browser cache
During the
http request process, some resources will be cached in the browser after the page is loaded for the first time, that is, those resources with status code 304. In order to simulate as accurately as possible the situation when a user loads our webpage for the first time, the browser cache needs to be disabled. In this way, each request is transmitted from the server, which more accurately reflects the actual situation of the initial loading of the webpage

You can select different network conditions in the
Network Throttling drop-down box Carry out simulation, such as 2G, 3G, 4G, WiFi, etc.

Network Throttling menu and select Custom > Add.
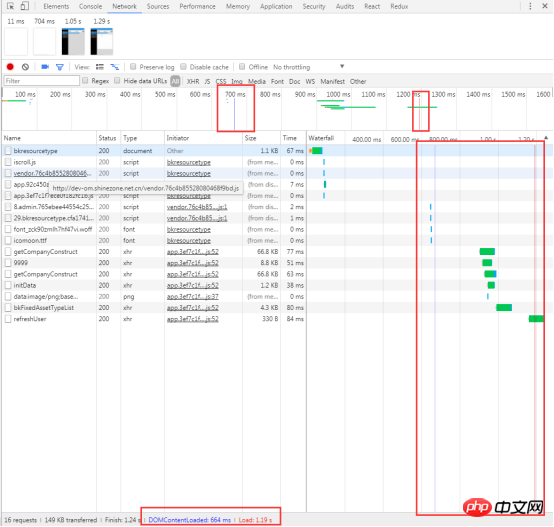
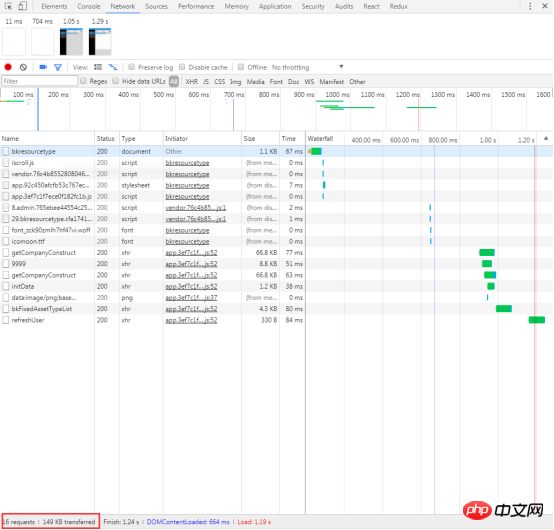
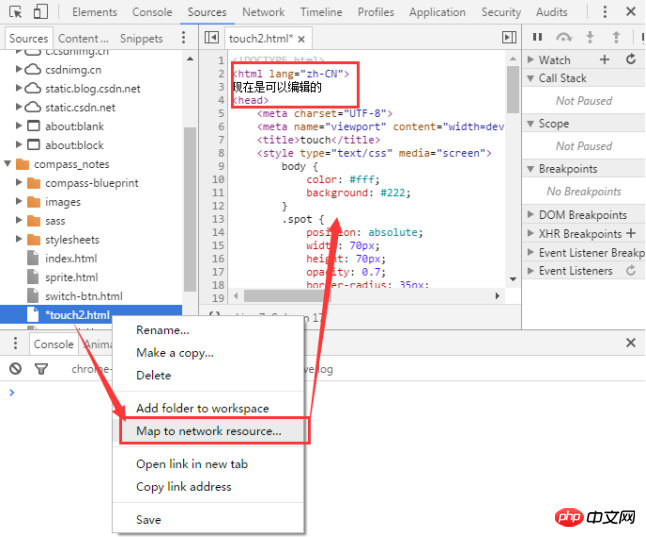
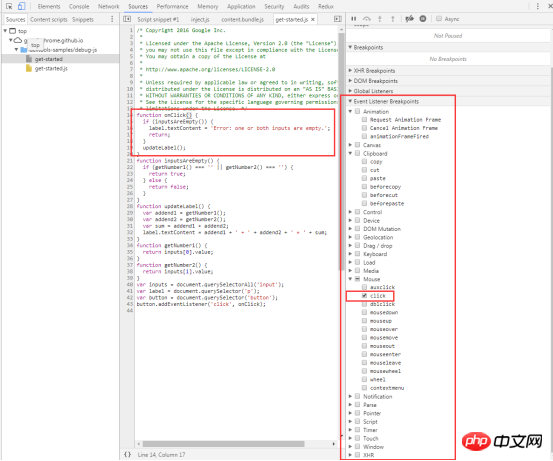
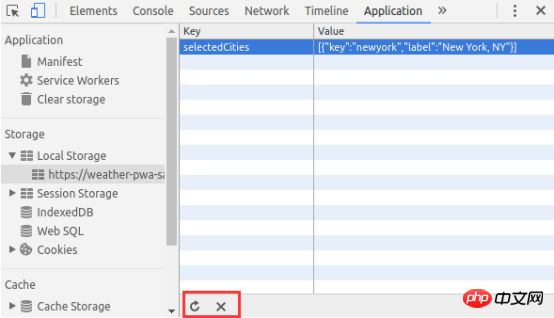
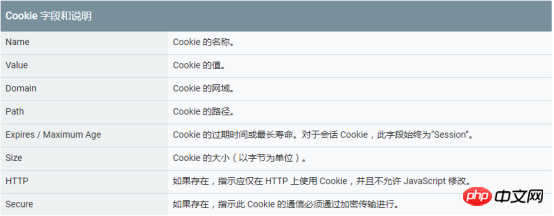
Another simulation situation is more special, that is, there is no network. Usingservice workers, PWA (Progressive Web Apps) can still be used without a network. To simulate this kind of network-free environment, just check Offline. Tips: Developers will see a warning icon on the left side of Network. This icon reminds developers that they are currently under simulated network conditions. Right-click in the network request record table and selectClear Browser Cache or Clear Browser Cookies. Click the funnel icon to change its color to blue, and then you can filter the items in the network request table The data is further filtered. You can enter some strings, fields, sizes, status codes, media types, etc. in the input box. Multiple selections are possible here: hold down the Command (Mac) key or Ctrl (Windows, Linux) key, and then click on different types. For example, click on JS and Img to filter out js files and images. Obviously, All does not coexist with other types. When selecting All, you cannot select a specific type. Name: the name of the file or the identifier of the resource Status: HTTP status code Type: MIME type of the requested resource Initiator: The following The object or handler can initiate a request Parse: Chrome's HTML parser Redirect: HTTP redirection Script: js function Other: Some other processing or operations, such as navigating to a page through a link, or entering an address in the browser's address bar and then Enter Size: response header size + response body size Time: total duration, from initiating the request to completing the resource download Waterfall: Visual display of different stages of each request activity Under the column Name, click on the URL of a request to view the details of the request and response. By default, request and response headers are displayed in alphabetical order http header names. If you want to display them in the order actually received, click on View source in the picture, otherwise click view parsed in the picture above. You can also view the requested parameters in the Headers tab, as shown in the orange box in the figure below. There are also view source and view parsed, as well as parameter encoding format (view URL encoded) and decoding format (view decoded). Preview: View the preview of the response body Response: View the response body Cookies: View cookies Queueing: The browser will queue the request under the following circumstances: There are higher priority requests There are already 6 TCP connections under this domain , reaching Chrome's maximum limit. This rule only applies to HTTP/1.0 and HTTP/1.1 Shift key, and then hover the mouse over a request. The initiating object of the request is marked in green, and the dependent object of the request is marked in red. DevTools displays the corresponding time when DOMContentLoaded and load events occur in multiple places. The DOMContentLoaded event corresponds to the purple line, and the load event corresponds to the red line The data here represents the data corresponding to the requests recorded after DevTools is opened. If some requests have occurred before DevTools is opened, the data of these requests are not counted here. Page resource search Implement code editing synchronization to local function Debuggingjavascript Find the list of resources requested by the page Development Or during the debugging process, you can automatically synchronize the modified code on the browser to the local file During the development process, you can use console.log() to find it Or correct errors in the code, but using "breakpoints" can greatly improve the speed and is more effective. Real-time editing code function This function can be modified and saved to a local file. Right-click "Add folder to workspace" in the sources workgroup to add the local folder to the workgroup, and open the folder you want in the added folder. The file you want to edit, or right-click on the file "Map to File System Resource...", or "Ctrl+o" to open the search panel and then open the file. After editing, press Ctrl+s to save, and it will also be modified in the local file. Debuggingjavascript (breakpoint) Breakpoints allow you to pause executing code and examine the values of all variables at the moment of pause. Check and click Event Listener Breakpoints to expand this section. When the click check box is selected, an event-based breakpoint is set on all click events. When any DOM node is clicked, and that node has a click handler, Devtools automatically pauses on the first line of that node's click handler. Note: This is just one of the many breakpoint types provided by DevTools. The type of breakpoint you should use depends on the type of problem you are trying to debug. You can debug the code step by step by clicking . Single-step debugging code Skip debugging code The script continues execution until it reaches the line of code where you set a breakpoint. Record all resource information loaded by the website , including stored data (Local Storage, Session Storage, IndexedDB, Web SQL, Cookies), cached data, fonts, pictures, scripts, style sheets, etc. View the local Storage of the page. View the page's Session Storage ##View and delete the page's cookie Double-click a key or value to modify the corresponding value. Double-click a blank cell to add a new entry. Click the corresponding entry , and then press the Delete button to delete the entry. Wipe all local storage data from the Clear storage pane with just a click of a button. If you interact with the page in a way that allows you to create, delete, or modify entries, you won't see those changes update in real time. Click the refresh button to view your changes. The Session Storage pane works the same as the Local Storage pane. See the Local Storage section above View related to Cookies Details such as name, value, domain, size, etc. Delete a single cookie, cookies for selected domains, or all cookies for all domains. Use the Cookies pane to view and delete cookies. You cannot modify cookie values. The following fields are provided for each Cookie: Cookies can be deleted in several ways: Select the Cookie and press the Delete button to delete the corresponding cookie. Press the Clear button to delete all cookies in the specified group. Use the Frames pane of the Application panel to organize the page by frame resource. Sometimes you just need to erase all data from a given source. The Clear Storage pane on the Application panel allows you to selectively log out service workers, storage, and caches. To clear data, simply enable the checkbox next to the component you want to erase and click Clear site data. This operation will clear all data from the sources listed under the Clear storage tag. Debugging Page security issues, ensure that it has been properly implemented on the websiteHTTPS Security Overview allows you to instantly see whether the current page is safe. This page is secure (valid HTTPS). View certificate to view the server certificate of the main source . This page is not secure.The Security panel can distinguish between two types of non-secure pages. If the requested page is served over HTTP, the primary origin is marked as unsafe. As shown below If the requested page is retrieved via HTTPS, but the page continues to use HTTP to retrieve content from another source, then the page will still be marked as unsafe. This is called a mixed content page. Mixed content pages are only partially protected because HTTP content can be picked up by sniffers and is vulnerable to man-in-the-middle attacks. As shown below If you click on a non-secure source, the Security panel provides a link to the Network panel's filtered view. CSS files, etc. Network Utilization, Web Page Performance, click the Run button, the network utilization and page performance optimization of the current page will be diagnosed, and corresponding optimization suggestions will be given. 
4.3.8 Manually clear browser cache and cookies
4.3.9 Filter by attributes


4.3.10 Filter by type
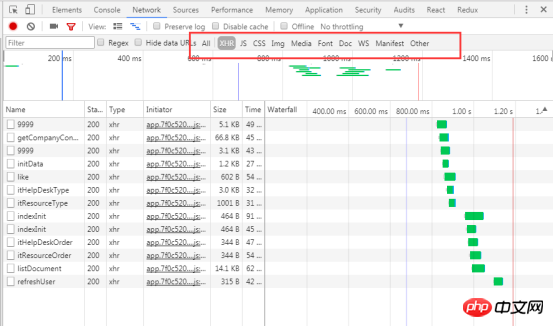
4.3.11 View request record
4.3.12 Headers: View Request headers, response headers and request parameters
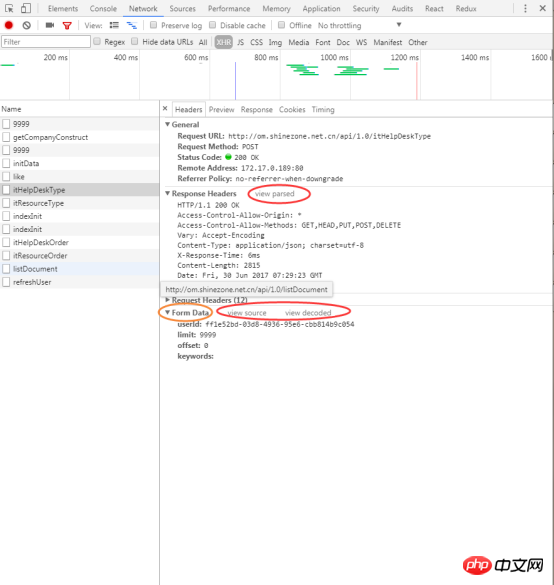
4.3.13 Timing: View the time corresponding to each stage of the request
##Stalled: Any factor in Queueing will cause the request to be delayed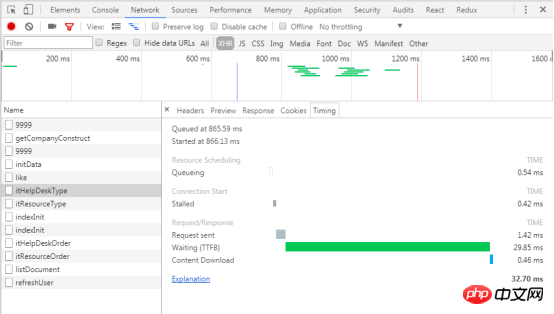
Press and hold
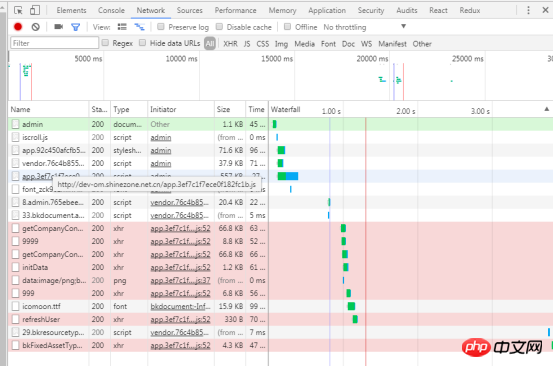
4.3.15 View loading events
4.3.16 View the total number and total size of requests
5 Sources
5.1 Function
5.2 Application Scenario
5.3 Operation


6 Application
6.1 Function
6.2 Application Scenario
6.3 Operation
6.3.1 View the local Storage of the page.
6.3.2 View the Session Storage of the page.
6.3.3 Viewing and deleting cookies on a page

6.3.4 View the resources of the page
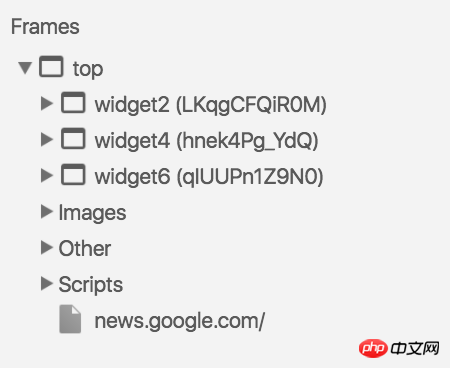
6.3.5 Clear all storage, database, cache and service worker threads.
7 Security
7.1 Function
7.2 Application scenarios
7.3 Operation7.3.1 Use Security Overview to immediately check whether the current page is safe.
The secure page will pass the message
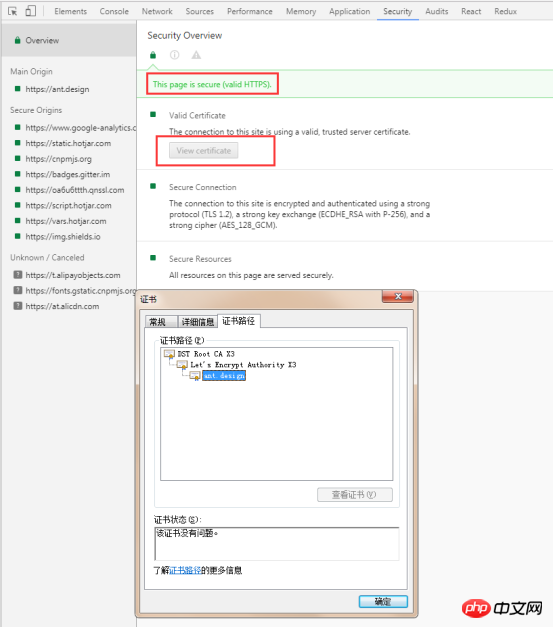
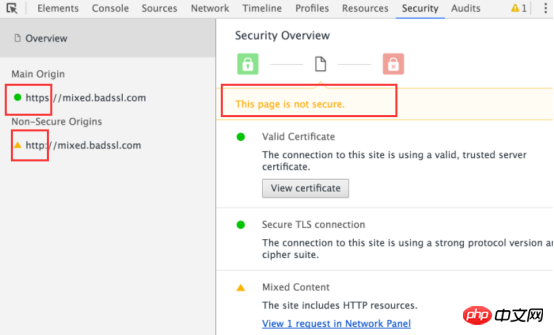
7.3.2 Check the source
Use the left panel to check each secure or non-secure source. Click a secure source to view the connection and certificate details of the source.
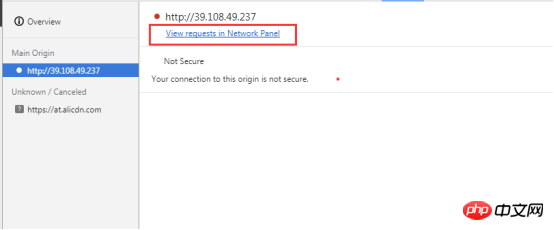

8.1 Function
Diagnose the network utilization and web page performance of the current web page, and give some optimization suggestions. For example, list all unused
Optimize the web page according to the diagnosis recommendations
8.3 OperationSelect
The above is the detailed content of Example tutorials for common functions of Chrome DevTools. For more information, please follow other related articles on the PHP Chinese website!

Hot AI Tools

Undresser.AI Undress
AI-powered app for creating realistic nude photos

AI Clothes Remover
Online AI tool for removing clothes from photos.

Undress AI Tool
Undress images for free

Clothoff.io
AI clothes remover

AI Hentai Generator
Generate AI Hentai for free.

Hot Article

Hot Tools

Notepad++7.3.1
Easy-to-use and free code editor

SublimeText3 Chinese version
Chinese version, very easy to use

Zend Studio 13.0.1
Powerful PHP integrated development environment

Dreamweaver CS6
Visual web development tools

SublimeText3 Mac version
God-level code editing software (SublimeText3)

Hot Topics
 1385
1385
 52
52
 What is Updater.exe in Windows 11/10? Is this the Chrome process?
Mar 21, 2024 pm 05:36 PM
Every application you run on Windows has a component program to update it. So if you are using Google Chrome or Google Earth, it will run a GoogleUpdate.exe application, check if an update is available, and then update it based on the settings. However, if you no longer see it and instead see a process updater.exe in the Task Manager of Windows 11/10, there is a reason for this. What is Updater.exe in Windows 11/10? Google has rolled out updates for all its apps like Google Earth, Google Drive, Chrome, etc. This update brings
 How to delete Xiaohongshu notes
Mar 21, 2024 pm 08:12 PM
How to delete Xiaohongshu notes? Notes can be edited in the Xiaohongshu APP. Most users don’t know how to delete Xiaohongshu notes. Next, the editor brings users pictures and texts on how to delete Xiaohongshu notes. Tutorial, interested users come and take a look! Xiaohongshu usage tutorial How to delete Xiaohongshu notes 1. First open the Xiaohongshu APP and enter the main page, select [Me] in the lower right corner to enter the special area; 2. Then in the My area, click on the note page shown in the picture below , select the note you want to delete; 3. Enter the note page, click [three dots] in the upper right corner; 4. Finally, the function bar will expand at the bottom, click [Delete] to complete.
 What file is crdownload?
Mar 08, 2023 am 11:38 AM
crdownload is a chrome browser download cache file, which is a file that has not been downloaded; crdownload file is a temporary file format used to store files downloaded from the hard disk. It can help users protect file integrity when downloading files and avoid being damaged. Unexpected interruption or stoppage. CRDownload files can also be used to back up files, allowing users to save temporary copies of files; if an unexpected error occurs during downloading, CRDownload files can be used to restore downloaded files.
 Can deleted notes on Xiaohongshu be recovered?
Oct 31, 2023 pm 05:36 PM
Notes deleted from Xiaohongshu cannot be recovered. As a knowledge sharing and shopping platform, Xiaohongshu provides users with the function of recording notes and collecting useful information. According to Xiaohongshu’s official statement, deleted notes cannot be recovered. The Xiaohongshu platform does not provide a dedicated note recovery function. This means that once a note is deleted in Xiaohongshu, whether it is accidentally deleted or for other reasons, it is generally impossible to retrieve the deleted content from the platform. If you encounter special circumstances, you can try to contact Xiaohongshu’s customer service team to see if they can help solve the problem.
 What to do if chrome cannot load plugins
Nov 06, 2023 pm 02:22 PM
Chrome's inability to load plug-ins can be solved by checking whether the plug-in is installed correctly, disabling and enabling the plug-in, clearing the plug-in cache, updating the browser and plug-ins, checking the network connection, and trying to load the plug-in in incognito mode. The solution is as follows: 1. Check whether the plug-in has been installed correctly and reinstall it; 2. Disable and enable the plug-in, click the Disable button, and then click the Enable button again; 3. Clear the plug-in cache, select Advanced Options > Clear Browsing Data, check cache images and files and clear all cookies, click Clear Data.
 What should I do if the notes I posted on Xiaohongshu are missing? What's the reason why the notes it just sent can't be found?
Mar 21, 2024 pm 09:30 PM
As a Xiaohongshu user, we have all encountered the situation where published notes suddenly disappeared, which is undoubtedly confusing and worrying. In this case, what should we do? This article will focus on the topic of "What to do if the notes published by Xiaohongshu are missing" and give you a detailed answer. 1. What should I do if the notes published by Xiaohongshu are missing? First, don't panic. If you find that your notes are missing, staying calm is key and don't panic. This may be caused by platform system failure or operational errors. Checking release records is easy. Just open the Xiaohongshu App and click "Me" → "Publish" → "All Publications" to view your own publishing records. Here you can easily find previously published notes. 3.Repost. If found
 What is the Chrome plug-in extension installation directory?
Mar 08, 2024 am 08:55 AM
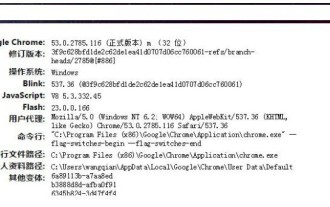
What is the Chrome plug-in extension installation directory? Under normal circumstances, the default installation directory of Chrome plug-in extensions is as follows: 1. The default installation directory location of chrome plug-ins in windowsxp: C:\DocumentsandSettings\username\LocalSettings\ApplicationData\Google\Chrome\UserData\Default\Extensions2. chrome in windows7 The default installation directory location of the plug-in: C:\Users\username\AppData\Local\Google\Chrome\User
 How to solve the problem that Google Chrome cannot open web pages
Jan 04, 2024 pm 10:18 PM
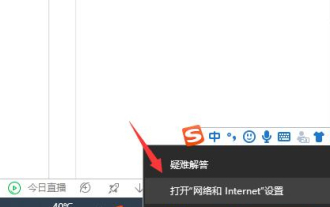
What should I do if the Google Chrome web page cannot be opened? Many friends like to use Google Chrome. Of course, some friends find that they cannot open web pages normally or the web pages open very slowly during use. So what should you do if you encounter this situation? Let’s take a look at the solution to the problem that Google Chrome web pages cannot be opened with the editor. Solution to the problem that the Google Chrome webpage cannot be opened. Method 1. In order to help players who have not passed the level yet, let us learn about the specific methods of solving the puzzle. First, right-click the network icon in the lower right corner and select "Network and Internet Settings." 2. Click "Ethernet" and then click "Change Adapter Options". 3. Click the "Properties" button. 4. Double-click to open i


