

What does the php debug_backtrace() function do?

定义和用法
PHP debug_backtrace() 函数生成一个 backtrace(回溯信息)。
该函数返回一个关联数组。下面是可能返回的元素:
| 名称 | 类型 | 描述 |
| function | 字符串 | 当前的函数名。 |
| line | 整数 | 当前的行号。 |
| file | 字符串 | 当前的文件名。 |
| class | 字符串 | 当前的类名 |
| object | 对象 | 当前对象。 |
| type | 字符串 | 当前的调用类型,可能的调用:
|
| args | 数组 | 如果在函数中,列出函数参数。如果在被引用的文件中,列出被引用的文件名。 |
语法
debug_backtrace()
例子
<?php
function one($str1, $str2) {
	two("Glenn", "Quagmire");
}

function two($str1, $str2) {
	three("Cleveland", "Brown");
}

function three($str1, $str2) {
	print_r(debug_backtrace());
}

one("Peter", "Griffin");输出:
Array
(
    [0] => Array
        (
            [file] => D:\PHP\xampp\htdocs\52php\123\789.php
            [line] => 7
            [function] => three
            [args] => Array
                (
                    [0] => Cleveland
                    [1] => Brown
                )

        )

    [1] => Array
        (
            [file] => D:\PHP\xampp\htdocs\52php\123\789.php
            [line] => 3
            [function] => two
            [args] => Array
                (
                    [0] => Glenn
                    [1] => Quagmire
                )

        )

    [2] => Array
        (
            [file] => D:\PHP\xampp\htdocs\52php\123\789.php
            [line] => 14
            [function] => one
            [args] => Array
                (
                    [0] => Peter
                    [1] => Griffin
                )

        )

)debug_backtrace函数理解1
debug_backtrace函数的作用为生成一个 backtrace。
debug_backtrace函数返回一个关联数组。
1.backtrace如何理解;
2.关联数组是否可以理解为可以新数组与原数组有联系;
debug_backtrace函数理解2
debug_backtrace函数的参数
function:当前的函数名。
1.当前的函数名是否为自定义的函数或者系统函数;
line:当前的行号。
1.line是否可以理解为调用函数所在的行数;
file:当前的文件名。
1.file可以理解为当前调试所在的文件
class:当前的类名
object:当前的对象。
type:当前的调用类型,可能的调用:
返回: "->" - 方法调用
返回: "::" - 静态方法调用
返回 nothing - 函数调用
1.各类方法的调用如何理解;
args[]数组如果在函数中,列出函数参数。如果在被引用的文件中,列出被引用的文件名。
debug_backtrace函数理解3
<?php
function one($str1, $str2) {
 two("Glenn", "Quagmire");
 }
function two($str1, $str2) {
 three("Cleveland", "Brown");
 }
function three($str1, $str2) {
 print_r(debug_backtrace());
 }
 one("Peter", "Griffin");
?>输出:
Array ( [0] => Array ( [file] => C:\wamp\www\web.php [line] => 89 [function] => three [args] => Array ( [0] => Cleveland [1] => Brown ) ) [1] => Array ( [file] => C:\wamp\www\web.php [line] => 86 [function] => two [args] => Array ( [0] => Glenn [1] => Quagmire ) ) [2] => Array ( [file] => C:\wamp\www\web.php [line] => 94 [function] => one [args] => Array ( [0] => Peter [1] => Griffin ) ) )
The above is the detailed content of What does the php debug_backtrace() function do?. For more information, please follow other related articles on the PHP Chinese website!

Hot AI Tools

Undresser.AI Undress
AI-powered app for creating realistic nude photos

AI Clothes Remover
Online AI tool for removing clothes from photos.

Undress AI Tool
Undress images for free

Clothoff.io
AI clothes remover

AI Hentai Generator
Generate AI Hentai for free.

Hot Article
Hot Tools

Notepad++7.3.1
Easy-to-use and free code editor

SublimeText3 Chinese version
Chinese version, very easy to use

Zend Studio 13.0.1
Powerful PHP integrated development environment

Dreamweaver CS6
Visual web development tools

SublimeText3 Mac version
God-level code editing software (SublimeText3)
Hot Topics
 1376
1376
 52
52

 How to solve the problem of invalid debugging when setting breakpoints in SpringBoot project
May 11, 2023 am 10:49 AM
How to solve the problem of invalid debugging when setting breakpoints in SpringBoot project
May 11, 2023 am 10:49 AM
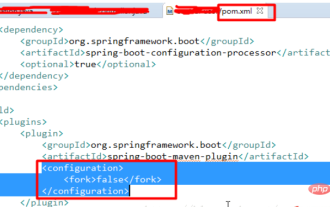
I am new to the springboot project. (1) I found that breakpoint debugging was ineffective. I was very depressed and searched for solutions online. All I saw were some very complicated solutions, which were said to be remote debugging, but also required additional opening slogans. This is different from a traditional project, so I don’t think it’s necessary. So after some exploration, I found that there is a simpler way. The steps are as follows: Add a configuration in the plugin part of the pom file: false and it will be ok; (2) Regarding the error in the SpringBoot project that the web.xml file is missing, because Traditional web projects require web.xml files, but SpringBoot projects do not require web.xml files.
 Take you to debug Nestjs project in VSCode (tutorial)
Apr 24, 2023 pm 05:53 PM
Take you to debug Nestjs project in VSCode (tutorial)
Apr 24, 2023 pm 05:53 PM
Friends who have used Vscode to write projects such as Node all know that if we want to troubleshoot a problem, we mostly print it through console.log to see where the problem is. If the problem involved is more complex, we will choose Through Vscode...
 How to use IDEA remote connection Debug in springboot
May 10, 2023 pm 11:55 PM
How to use IDEA remote connection Debug in springboot
May 10, 2023 pm 11:55 PM
1. First create a Demo ready for remote debugging. Pay attention to the configuration of the build project 4.0.0org.springframework.bootspring-boot-starter-parent2.1.4.RELEASEcom.remote.testremote_test0.0.1-SNAPSHOTremote_testDemoprojectforSpringBoot1.8org.springframework.bootspring-boot- starterorg.springframework.bootspring-bo
 How to effectively deal with overflow problems
Jan 27, 2024 am 09:39 AM
How to effectively deal with overflow problems
Jan 27, 2024 am 09:39 AM
How to Correctly Deal with Overflow Problems Overflow is a common computer programming problem, especially when dealing with numbers or arrays. Overflow occurs when we try to store a value that exceeds the allowed range of the data type. The key to solving this problem lies in correctly handling and validating data boundaries. Several common overflow problems and corresponding solutions will be introduced below. Integer overflow Integer overflow means that during calculation, the result exceeds the representation range of the integer type. For example, in the 32-bit signed integer type in
 UCIe 2.0: Advancing the open chiplet ecosystem with 3D packaging and manageability
Aug 08, 2024 pm 12:51 PM
UCIe 2.0: Advancing the open chiplet ecosystem with 3D packaging and manageability
Aug 08, 2024 pm 12:51 PM
The Universal Chiplet Interconnect Express (UCIe) Consortium has announced the release of the UCIe 2.0 specification, further advancing the open chiplet ecosystem. The latest specification introduces several key enhancements. First, it adds support f
 How to use Nocalhost and enable debugging in Python
May 14, 2023 pm 03:16 PM
How to use Nocalhost and enable debugging in Python
May 14, 2023 pm 03:16 PM
Nocalhost is a developer tool that supports debugging and deployment of Kubernetes applications. Using Nocalhost for Python development requires completing the following steps: Install Nocalhost CLI. It can be installed through the installation package provided by Nocalhost official website. Configure the Kubernetes cluster and install the Nocalhost plugin. You can refer to the guidance provided in Nocalhost official documentation. Install the Python interpreter and debugger on the local computer, such as Python's own pdb or third-party libraries pudb, ipdb, etc. Create a Python project and add the debugger calling statement to the code,
 What is the method of debugging in Python?
Apr 29, 2023 pm 09:01 PM
What is the method of debugging in Python?
Apr 29, 2023 pm 09:01 PM
The test code used in this article: fromtorchvisionimporttransformsfromtorchvision.datasetsimportFashionMNISTimportosos.environ["KMP_DUPLICATE_LIB_OK"]="TRUE"#Dataset preparation train_data=FashionMNIST(root="./data/FashionMNIST",train=True,transform=transforms.
 How to debug code in PHP
May 23, 2023 pm 05:40 PM
How to debug code in PHP
May 23, 2023 pm 05:40 PM
When developing PHP applications, you often encounter situations where you need to debug code. Debugging is a necessary step to troubleshoot program problems, find errors in your code, and improve program performance. In PHP, debugging is done using a debugger. This article will introduce how to use the debugger to debug code in PHP. 1. Configure the debugging environment. Before starting debugging, you need to configure the debugging environment. The purpose of configuring the debugging environment is to enable the debugger to run to help you debug your code. There are two main types of PHP debuggers: XDebug and ZendDebug
