Introduction to JVM Basics: Runtime Data Area

I believe this picture should be familiar to anyone who has some contact with JVM. It can be said that this is JVMThe first lesson of getting started. Among them, "Heap" and "Virtual Machine Stack (Stack)” is even more familiar. The following will give a brief introduction to the runtime data area of JVM around this picture.
Program Counter(Program Counter Register)
This is related to computer operation The program counter in the system is similar. In the computer operating system, the program counter represents the address of the next instruction to be executed by this process. The program counter in JVM can be regarded as the address executed by the current thread. The bytecode line number indicator, each thread has a program counter (this is easy to understand, each thread is executing tasks, if the thread is switched, it must be able to be restored to the correct position), the important point is —— Program counter, this is the only one in the JVM specification that does not specify that it will cause OutOfMemory (Memory leak, hereinafter referred to as OOM) area . In other words, the remaining 4 areas in the above picture may cause OOM.
☆Virtual Machine Stacks (Java Virtual Machine Stacks)
## This memory area is what we often Said"Stack", what we know well is that it is used to store variables, that is to say, for example:
int i = 0;
4 bytes to store i variables. The memory space for variables can be determined from the beginning (for reference variables, of course it stores an address reference, and its size is also fixed), so this memory area can be determined by the compiler. This area may Will throw StackOverflowError or OOM error. Set JVM parameters ”-Xss228k” (stack size is 228k).
1 package com.jvm; 2 3 /** 4 * -Xss228k,虚拟机栈大小为228k 5 * Created by yulinfeng on 7/11/17. 6 */ 7 public class Test { 8 private static int count = 0; 9 10 public static void main(String[] args) {11 Test test = new Test();12 test.test();13 }14 15 /**16 * 递归调用17 */18 private void test() {19 try {20 count++;21 test();22 } catch (Throwable e) { //Exception已经捕获不了JVM抛出的StackOverflowError23 System.out.println("递归调用次数" + count);24 e.printStackTrace();25 }26 }27 }This is a recursion without termination conditions. The execution result is as shown in the figure below. JVM throws StackOverflowError indicates the stack depth requested by the thread. Greater than the depth allowed by JVM.

For single-threaded situations, StackOverflowError is thrown no matter what. If an OOM exception is thrown, the cause is that threads are continuously created until the memory is exhausted.
The memory of JVM consists of heap memory + method area memory + remaining memory, That is, the remaining memory =The memory allocated by the operating system to JVM - heap Memory - Method area memory. -Xss sets the stack capacity of each thread, which means the number of threads that can be created = Remaining memory / Stack memory. At this time, if the stack memory is larger, the number of threads that can be created will be smaller, and OOM will easily occur; if the stack memory is smaller, the number of threads that can be created will be larger, and it will not be easy. OOM appears.
The best way to avoid this situation is to reduce the heap memory + method area memory, or appropriately reduce the stack memory. For stack memory configuration, generally use the default value 1M, or use 64 bit operating system and 64 bits of JVM.
Native Method Stack(Native Method Stack)
Local method stack Similar to the virtual machine stack, the difference is that the virtual machine stack serves the Java method, while the local method stack serves the Native method. In the HotSpot virtual machine implementation, the local method stack and the virtual machine stack are combined into one. Similarly, it will also throw StackOverflowError and OOM exceptions.
☆Java Heap
对于堆,Java程序员都知道对象实例以及数组内存都要在堆上分配。堆不再被线程所独有而是共享的一块区域,它的确是用来存放对象实例,也是垃圾回收GC的主要区域。实际上它还能细分为:新生代(Young Generation)、老年代(Old Generation)。对于新生代又分为Eden空间、From Survivor空间、To Survivor空间。至于为什么这么分,这涉及JVM的垃圾回收机制,在这里不做叙述。堆同样会抛出OOM异常,下面例子设置JVM参数” -Xms20M -Xmx20M“(前者表示初始堆大小20M,后者表示最大堆大小20M)。
1 package com.jvm; 2 3 import java.util.ArrayList; 4 import java.util.List; 5 6 /** 7 * -Xms20M -Xmx20M 堆初始大小20M 堆最大大小20M 8 * Created by yulinfeng on 7/11/17. 9 */10 public class Test {11 12 public static void main(String[] args) {13 List<Test> list = new ArrayList<Test>();14 int count = 0;15 try {16 while (true) {17 count++;18 list.add(new Test()); //不断创建线程19 }20 } catch (Throwable e) {21 System.out.println("创建实例个数:" + count);22 e.printStackTrace();23 }24 25 }26 }执行的结果可以清楚地看到堆上的内存空间溢出了。

☆方法区(Method Area)
对于JVM的方法区,可能听得最多的是另外一个说法——永久代(Permanent Generation),呼应堆的新生代和老年代。方法区和堆的划分是JVM规范的定义,而不同虚拟机有不同实现,对于Hotspot虚拟机来说,将方法区纳入GC管理范围,这样就不必单独管理方法区的内存,所以就有了”永久代“这么一说。方法区和操作系统进程的正文段(Text Segment)的作用非常类似,它存储的是已被虚拟机加载的类信息、常量(从JDK7开始已经移至堆内存中)、静态变量等数据。现设置JVM参数为”-XX:MaxPermSize=20M”(方法区最大内存为20M)。
1 package com.jvm; 2 3 import java.util.ArrayList; 4 import java.util.List; 5 6 /** 7 * -XX:MaxPermSize=20M 方法区最大大小20M 8 * Created by yulinfeng on 7/11/17. 9 */10 public class Test {11 12 public static void main(String[] args) {13 List<String> list = new ArrayList<String>();14 int i = 0;15 while (true) {16 list.add(String.valueOf(i++).intern()); //不断创建线程17 }18 }19 }In fact, for the above code, the running results are in JDK6, JDK7, JDK8 All are different. The reason is that the string constant pool is still stored in the method area (permanent generation) in JDK6, so it will throw OutOfMemoryError:Permanent Space ; After JDK7, the string constant pool was moved to the Java heap, and the above code will not throw OOM, if the heap memory is changed to 20M, OutOfMemoryError:Java heap space## will be thrown #; As for JDK8, the concept of method area has been completely canceled and replaced by ”metaspace(Metaspace)", so in JDK8 the virtual machine parameters"-XX:MaxPermSize" has no meaning, and is replaced by "-XX:MetaspaceSize"and" -XX:MaxMetaspaceSize” etc.
The above is the detailed content of Introduction to JVM Basics: Runtime Data Area. For more information, please follow other related articles on the PHP Chinese website!

Hot AI Tools

Undresser.AI Undress
AI-powered app for creating realistic nude photos

AI Clothes Remover
Online AI tool for removing clothes from photos.

Undress AI Tool
Undress images for free

Clothoff.io
AI clothes remover

AI Hentai Generator
Generate AI Hentai for free.

Hot Article

Hot Tools

Notepad++7.3.1
Easy-to-use and free code editor

SublimeText3 Chinese version
Chinese version, very easy to use

Zend Studio 13.0.1
Powerful PHP integrated development environment

Dreamweaver CS6
Visual web development tools

SublimeText3 Mac version
God-level code editing software (SublimeText3)

Hot Topics
 A Diffusion Model Tutorial Worth Your Time, from Purdue University
Apr 07, 2024 am 09:01 AM
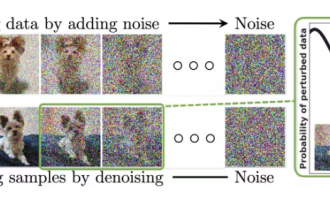
Diffusion can not only imitate better, but also "create". The diffusion model (DiffusionModel) is an image generation model. Compared with the well-known algorithms such as GAN and VAE in the field of AI, the diffusion model takes a different approach. Its main idea is a process of first adding noise to the image and then gradually denoising it. How to denoise and restore the original image is the core part of the algorithm. The final algorithm is able to generate an image from a random noisy image. In recent years, the phenomenal growth of generative AI has enabled many exciting applications in text-to-image generation, video generation, and more. The basic principle behind these generative tools is the concept of diffusion, a special sampling mechanism that overcomes the limitations of previous methods.
 Generate PPT with one click! Kimi: Let the 'PPT migrant workers' become popular first
Aug 01, 2024 pm 03:28 PM
Kimi: In just one sentence, in just ten seconds, a PPT will be ready. PPT is so annoying! To hold a meeting, you need to have a PPT; to write a weekly report, you need to have a PPT; to make an investment, you need to show a PPT; even when you accuse someone of cheating, you have to send a PPT. College is more like studying a PPT major. You watch PPT in class and do PPT after class. Perhaps, when Dennis Austin invented PPT 37 years ago, he did not expect that one day PPT would become so widespread. Talking about our hard experience of making PPT brings tears to our eyes. "It took three months to make a PPT of more than 20 pages, and I revised it dozens of times. I felt like vomiting when I saw the PPT." "At my peak, I did five PPTs a day, and even my breathing was PPT." If you have an impromptu meeting, you should do it
 All CVPR 2024 awards announced! Nearly 10,000 people attended the conference offline, and a Chinese researcher from Google won the best paper award
Jun 20, 2024 pm 05:43 PM
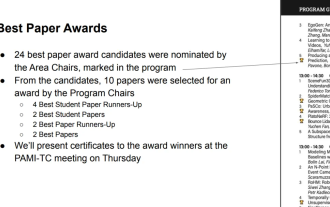
In the early morning of June 20th, Beijing time, CVPR2024, the top international computer vision conference held in Seattle, officially announced the best paper and other awards. This year, a total of 10 papers won awards, including 2 best papers and 2 best student papers. In addition, there were 2 best paper nominations and 4 best student paper nominations. The top conference in the field of computer vision (CV) is CVPR, which attracts a large number of research institutions and universities every year. According to statistics, a total of 11,532 papers were submitted this year, and 2,719 were accepted, with an acceptance rate of 23.6%. According to Georgia Institute of Technology’s statistical analysis of CVPR2024 data, from the perspective of research topics, the largest number of papers is image and video synthesis and generation (Imageandvideosyn
 Five programming software for getting started with learning C language
Feb 19, 2024 pm 04:51 PM
As a widely used programming language, C language is one of the basic languages that must be learned for those who want to engage in computer programming. However, for beginners, learning a new programming language can be difficult, especially due to the lack of relevant learning tools and teaching materials. In this article, I will introduce five programming software to help beginners get started with C language and help you get started quickly. The first programming software was Code::Blocks. Code::Blocks is a free, open source integrated development environment (IDE) for
 PyCharm Community Edition Installation Guide: Quickly master all the steps
Jan 27, 2024 am 09:10 AM
Quick Start with PyCharm Community Edition: Detailed Installation Tutorial Full Analysis Introduction: PyCharm is a powerful Python integrated development environment (IDE) that provides a comprehensive set of tools to help developers write Python code more efficiently. This article will introduce in detail how to install PyCharm Community Edition and provide specific code examples to help beginners get started quickly. Step 1: Download and install PyCharm Community Edition To use PyCharm, you first need to download it from its official website
 A must-read for technical beginners: Analysis of the difficulty levels of C language and Python
Mar 22, 2024 am 10:21 AM
Title: A must-read for technical beginners: Difficulty analysis of C language and Python, requiring specific code examples In today's digital age, programming technology has become an increasingly important ability. Whether you want to work in fields such as software development, data analysis, artificial intelligence, or just learn programming out of interest, choosing a suitable programming language is the first step. Among many programming languages, C language and Python are two widely used programming languages, each with its own characteristics. This article will analyze the difficulty levels of C language and Python
 From bare metal to a large model with 70 billion parameters, here is a tutorial and ready-to-use scripts
Jul 24, 2024 pm 08:13 PM
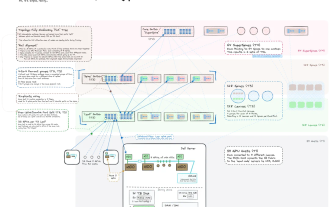
We know that LLM is trained on large-scale computer clusters using massive data. This site has introduced many methods and technologies used to assist and improve the LLM training process. Today, what we want to share is an article that goes deep into the underlying technology and introduces how to turn a bunch of "bare metals" without even an operating system into a computer cluster for training LLM. This article comes from Imbue, an AI startup that strives to achieve general intelligence by understanding how machines think. Of course, turning a bunch of "bare metal" without an operating system into a computer cluster for training LLM is not an easy process, full of exploration and trial and error, but Imbue finally successfully trained an LLM with 70 billion parameters. and in the process accumulate
 Counting down the 12 pain points of RAG, NVIDIA senior architect teaches solutions
Jul 11, 2024 pm 01:53 PM
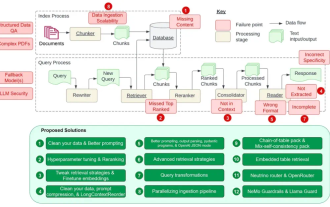
Retrieval-augmented generation (RAG) is a technique that uses retrieval to boost language models. Specifically, before a language model generates an answer, it retrieves relevant information from an extensive document database and then uses this information to guide the generation process. This technology can greatly improve the accuracy and relevance of content, effectively alleviate the problem of hallucinations, increase the speed of knowledge update, and enhance the traceability of content generation. RAG is undoubtedly one of the most exciting areas of artificial intelligence research. For more details about RAG, please refer to the column article on this site "What are the new developments in RAG, which specializes in making up for the shortcomings of large models?" This review explains it clearly." But RAG is not perfect, and users often encounter some "pain points" when using it. Recently, NVIDIA’s advanced generative AI solution


