Some simple tests for PHP
php-ml is a machine learning library written in PHP. Although we know that python or C++ provide more machine learning libraries, in fact, most of them are slightly complicated, and many novices feel hopeless when configuring them. Although the machine learning library php-ml does not have particularly advanced algorithms, it does have the most basic machine learning, classification and other algorithms. It is sufficient for our small company to do some simple data analysis, prediction, etc. In our projects, what we pursue should be cost-effectiveness, not excessive efficiency and precision. Some algorithms and libraries look very powerful, but if we consider going online quickly and our technical staff have no experience in machine learning, complex code and configuration will actually drag down our project. And if we are making a simple machine learning application, then the learning cost of studying complex libraries and algorithms is obviously a bit high. Moreover, if the project encounters strange problems, can we solve them? What should I do if my needs change? I believe everyone has had this experience: while working, the program suddenly reported an error, and I couldn't figure out the reason. I searched on Google or Baidu and found only one question that met the conditions. It was asked five or ten years ago. , and then zero reply. . . Therefore, it is necessary to choose the simplest, most efficient and most cost-effective method. The speed of php-ml is not slow (change to php7 quickly), and the accuracy is also good. After all, the algorithms are the same, and php is based on c. What bloggers dislike the most is comparing the performance and scope of application between Python, Java and PHP. If you really want performance, please develop in C. If you really want to pursue the scope of application, please use C or even assembly. . .
First, if we want to use this library, we need to download it first. This library file can be downloaded from github (). Of course, it is more recommended to use composer to download the library and configure it automatically.
After downloading, we can take a look at the documentation of this library. The documents are some simple examples. We can create a file ourselves and try it out. All are easy to understand. Next, let's test it on actual data. One of the data sets is the data set of Iris stamens, and the other is due to the loss of records, so I don’t know what the data is about. . .
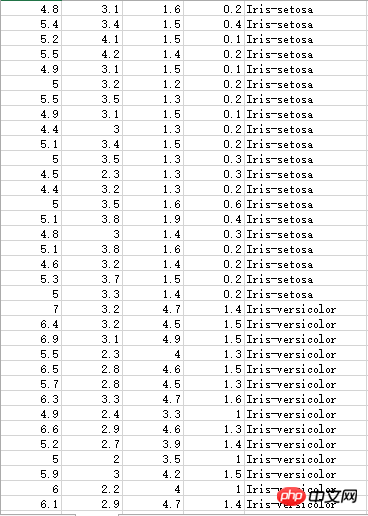
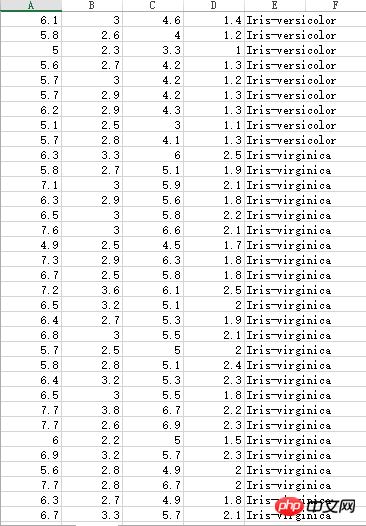
Iris stamen part data has three different categories:
 Still need to process:
. First, the file name of our unknown dataset is data.txt. This data set can just be drawn into an x-y line chart first. Therefore, we first draw the original data into a line chart. Since the x-axis is relatively long, we only need to see its rough shape:


1 <?php 2 include_once './src/jpgraph.php'; 3 include_once './src/jpgraph_line.php'; 4 5 $g = new Graph(1920,1080);//jpgraph的绘制操作 6 $g->SetScale("textint"); 7 $g->title->Set('data'); 8 9 //文件的处理10 $file = fopen('data.txt','r');11 $labels = array();12 while(!feof($file)){13 $data = explode(' ',fgets($file));
14 $data[1] = str_replace(',','.',$data[1]);//数据处理,将数据中的逗号修正为小数点15 $labels[(int)$data[0]] = (float)$data[1];//这里将数据以键值的方式存入数组,方便我们根据键来排序16 }
17 18 ksort($labels);//按键的大小排序19 20 $x = array();//x轴的表示数据21 $y = array();//y轴的表示数据22 foreach($labels as $key=>$value){23 array_push($x,$key);24 array_push($y,$value);25 }26 27 28 $linePlot = new LinePlot($y);29 $g->xaxis->SetTickLabels($x);
30 $linePlot->SetLegend('data');31 $g->Add($linePlot);32 $g->Stroke(); Now that we have this original picture for comparison, let’s study next. We use LeastSquars in php-ml for learning. The output of our test needs to be saved in a file so that we can draw a comparison chart. The learning code is as follows:
1 <?php 2 require 'vendor/autoload.php'; 3 4 use Phpml\Regression\LeastSquares; 5 use Phpml\ModelManager; 6 7 $file = fopen('data.txt','r'); 8 $samples = array(); 9 $labels = array();10 $i = 0;11 while(!feof($file)){12 $data = explode(' ',fgets($file));13 $samples[$i][0] = (int)$data[0];14 $data[1] = str_replace(',','.',$data[1]);15 $labels[$i] = (float)$data[1];16 $i ++;17 }
18 fclose($file);19 20 $regression = new LeastSquares();21 $regression->train($samples,$labels);22 23 //这个a数组是根据我们对原数据处理后的x值给出的,做测试用。24 $a = [0,2,3,4,5,6,7,8,9,10,11,12,13,14,15,16,17,18,20,22,23,24,25,26,27,29,30,31,37,40,41,45,48,53,55,57,60,61,108,124];25 for($i = 0; $i < count($a); $i ++){26 file_put_contents("putput.txt",($regression->predict([$a[$i]]))."\n",FILE_APPEND); //以追加的方式存入文件 27 } 1 <?php 2 include_once './src/jpgraph.php'; 3 include_once './src/jpgraph_line.php'; 4 5 $g = new Graph(1920,1080); 6 $g->SetScale("textint"); 7 $g->title->Set('data'); 8 9 $file = fopen('putput.txt','r');10 $y = array();11 $i = 0;12 while(!feof($file)){13 $y[$i] = (float)(fgets($file));14 $i ++;
15 }
16 17 $x = [0,2,3,4,5,6,7,8,9,10,11,12,13,14,15,16,17,18,20,22,23,24,25,26,27,29,30,31,37,40,41,45,48,53,55,57,60,61,108,124];18 19 $linePlot = new LinePlot($y);20 $g->xaxis->SetTickLabels($x);
21 $linePlot->SetLegend('data');22 $g->Add($linePlot);23 $g->Stroke();可以发现,图形出入还是比较大的,尤其是在图形锯齿比较多的部分。不过,这毕竟是40组数据,我们可以看出,大概的图形趋势是吻合的。一般的库在做这种学习时,数据量低的情况下,准确度都非常低。要达到比较高的精度,需要大量的数据,万条以上的数据量是必要的。如果达不到这个数据要求,那我们使用任何库都是徒劳的。所以,机器学习的实践中,真正难的不在精度低、配置复杂等技术问题,而是数据量不够,或者质量太低(一组数据中无用的数据太多)。在做机器学习之前,对数据的预先处理也是必要的。
接下来,我们来对花蕊数据进行测试。一共三种分类,由于我们下载到的是csv数据,所以我们可以使用php-ml官方提供的操作csv文件的方法。而这里是一个分类问题,所以我们选择库提供的SVC算法来进行分类。我们把花蕊数据的文件名定为Iris.csv,代码如下:
1 <?php 2 require 'vendor/autoload.php'; 3 4 use Phpml\Classification\SVC; 5 use Phpml\SupportVectorMachine\Kernel; 6 use Phpml\Dataset\CsvDataset; 7 8 $dataset = new CsvDataset('Iris.csv' , 4, false); 9 $classifier = new SVC(Kernel::LINEAR,$cost = 1000);10 $classifier->train($dataset->getSamples(),$dataset->getTargets());11 12 echo $classifier->predict([$argv[1],$argv[2],$argv[3],$argv[4]]);//$argv是命令行参数,调试这种程序使用命令行较方便
是不是很简单?短短12行代码就搞定了。接下来,我们来测试一下。根据我们上面贴出的图,当我们输入5 3.3 1.4 0.2的时候,输出应该是Iris-setosa。我们看一下:

看,至少我们输入一个原来就有的数据,得到了正确的结果。但是,我们输入原数据集中没有的数据呢?我们来测试两组:

由我们之前贴出的两张图的数据看,我们输入的数据在数据集中并不存在,但分类按照我们初步的观察来看,是合理的。
所以,这个机器学习库对于大多数的人来说,都是够用的。而大多数鄙视这个库鄙视那个库,大谈性能的人,基本上也不是什么大牛。真正的大牛已经忙着捞钱去了,或者正在做学术研究等等。我们更多的应该是掌握算法,了解其中的道理和玄机,而不是夸夸其谈。当然,这个库并不建议用在大型项目上,只推荐小型项目或者个人项目等。
The above is the detailed content of Some simple tests for PHP. For more information, please follow other related articles on the PHP Chinese website!

Hot AI Tools

Undresser.AI Undress
AI-powered app for creating realistic nude photos

AI Clothes Remover
Online AI tool for removing clothes from photos.

Undress AI Tool
Undress images for free

Clothoff.io
AI clothes remover

Video Face Swap
Swap faces in any video effortlessly with our completely free AI face swap tool!

Hot Article

Hot Tools

Notepad++7.3.1
Easy-to-use and free code editor

SublimeText3 Chinese version
Chinese version, very easy to use

Zend Studio 13.0.1
Powerful PHP integrated development environment

Dreamweaver CS6
Visual web development tools

SublimeText3 Mac version
God-level code editing software (SublimeText3)

Hot Topics
 1386
1386
 52
52
 PHP 8.4 Installation and Upgrade guide for Ubuntu and Debian
Dec 24, 2024 pm 04:42 PM
PHP 8.4 brings several new features, security improvements, and performance improvements with healthy amounts of feature deprecations and removals. This guide explains how to install PHP 8.4 or upgrade to PHP 8.4 on Ubuntu, Debian, or their derivati
 How To Set Up Visual Studio Code (VS Code) for PHP Development
Dec 20, 2024 am 11:31 AM
Visual Studio Code, also known as VS Code, is a free source code editor — or integrated development environment (IDE) — available for all major operating systems. With a large collection of extensions for many programming languages, VS Code can be c
 7 PHP Functions I Regret I Didn't Know Before
Nov 13, 2024 am 09:42 AM
If you are an experienced PHP developer, you might have the feeling that you’ve been there and done that already.You have developed a significant number of applications, debugged millions of lines of code, and tweaked a bunch of scripts to achieve op
 Explain JSON Web Tokens (JWT) and their use case in PHP APIs.
Apr 05, 2025 am 12:04 AM
JWT is an open standard based on JSON, used to securely transmit information between parties, mainly for identity authentication and information exchange. 1. JWT consists of three parts: Header, Payload and Signature. 2. The working principle of JWT includes three steps: generating JWT, verifying JWT and parsing Payload. 3. When using JWT for authentication in PHP, JWT can be generated and verified, and user role and permission information can be included in advanced usage. 4. Common errors include signature verification failure, token expiration, and payload oversized. Debugging skills include using debugging tools and logging. 5. Performance optimization and best practices include using appropriate signature algorithms, setting validity periods reasonably,
 How do you parse and process HTML/XML in PHP?
Feb 07, 2025 am 11:57 AM
This tutorial demonstrates how to efficiently process XML documents using PHP. XML (eXtensible Markup Language) is a versatile text-based markup language designed for both human readability and machine parsing. It's commonly used for data storage an
 PHP Program to Count Vowels in a String
Feb 07, 2025 pm 12:12 PM
A string is a sequence of characters, including letters, numbers, and symbols. This tutorial will learn how to calculate the number of vowels in a given string in PHP using different methods. The vowels in English are a, e, i, o, u, and they can be uppercase or lowercase. What is a vowel? Vowels are alphabetic characters that represent a specific pronunciation. There are five vowels in English, including uppercase and lowercase: a, e, i, o, u Example 1 Input: String = "Tutorialspoint" Output: 6 explain The vowels in the string "Tutorialspoint" are u, o, i, a, o, i. There are 6 yuan in total
 Explain late static binding in PHP (static::).
Apr 03, 2025 am 12:04 AM
Static binding (static::) implements late static binding (LSB) in PHP, allowing calling classes to be referenced in static contexts rather than defining classes. 1) The parsing process is performed at runtime, 2) Look up the call class in the inheritance relationship, 3) It may bring performance overhead.
 What are PHP magic methods (__construct, __destruct, __call, __get, __set, etc.) and provide use cases?
Apr 03, 2025 am 12:03 AM
What are the magic methods of PHP? PHP's magic methods include: 1.\_\_construct, used to initialize objects; 2.\_\_destruct, used to clean up resources; 3.\_\_call, handle non-existent method calls; 4.\_\_get, implement dynamic attribute access; 5.\_\_set, implement dynamic attribute settings. These methods are automatically called in certain situations, improving code flexibility and efficiency.


