
 Java
javaTutorial
Example analysis: statistical information management, Spring annotation development and EasyUI
Java
javaTutorial
Example analysis: statistical information management, Spring annotation development and EasyUI
Example analysis: statistical information management, Spring annotation development and EasyUI
Author: kentpeng
Please indicate the source for reprinting:
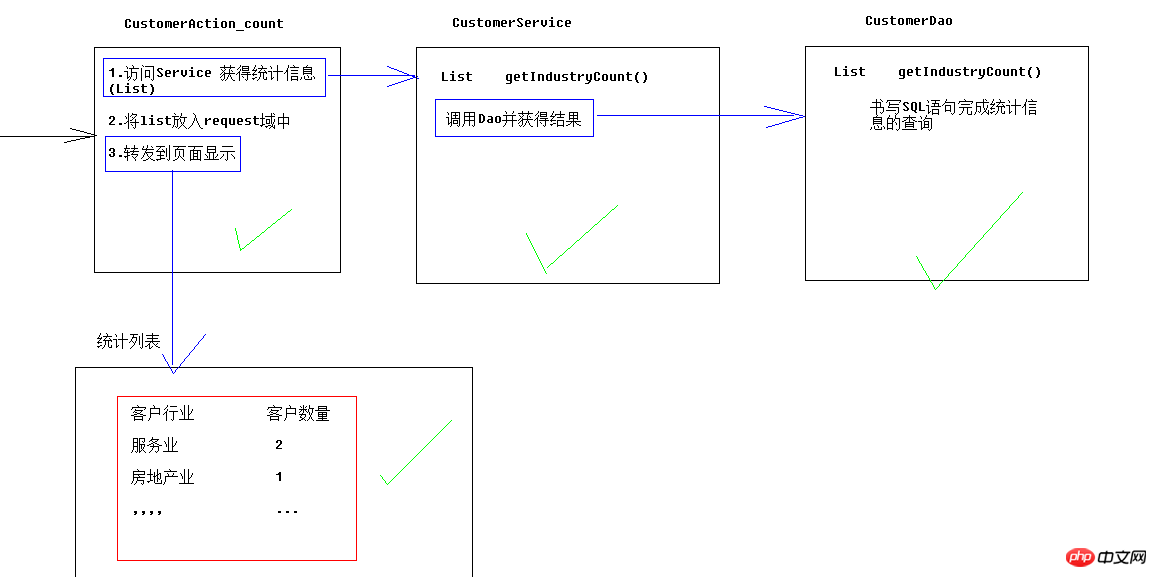
1. Statistical information management
二、Spring annotation development
1.Service is an example
@Service("customerService")
@Transactional(isolation=Isolation.REPEATABLE_READ,propagation=Propagation.REQUIRED,readOnly=false)public class CustomerServiceImpl implements CustomerService {
@Resource(name="customerDao")private CustomerDao cd;三、EasyUI
1.Develop for enterprises Eliminate the art front-end. Comes with a set of page styles and effects.
Use fastjson-1.2.8.jar for json.
Mainly refer to the documentation and examples for development. The following is an example of adding, deleting, modifying and checking:
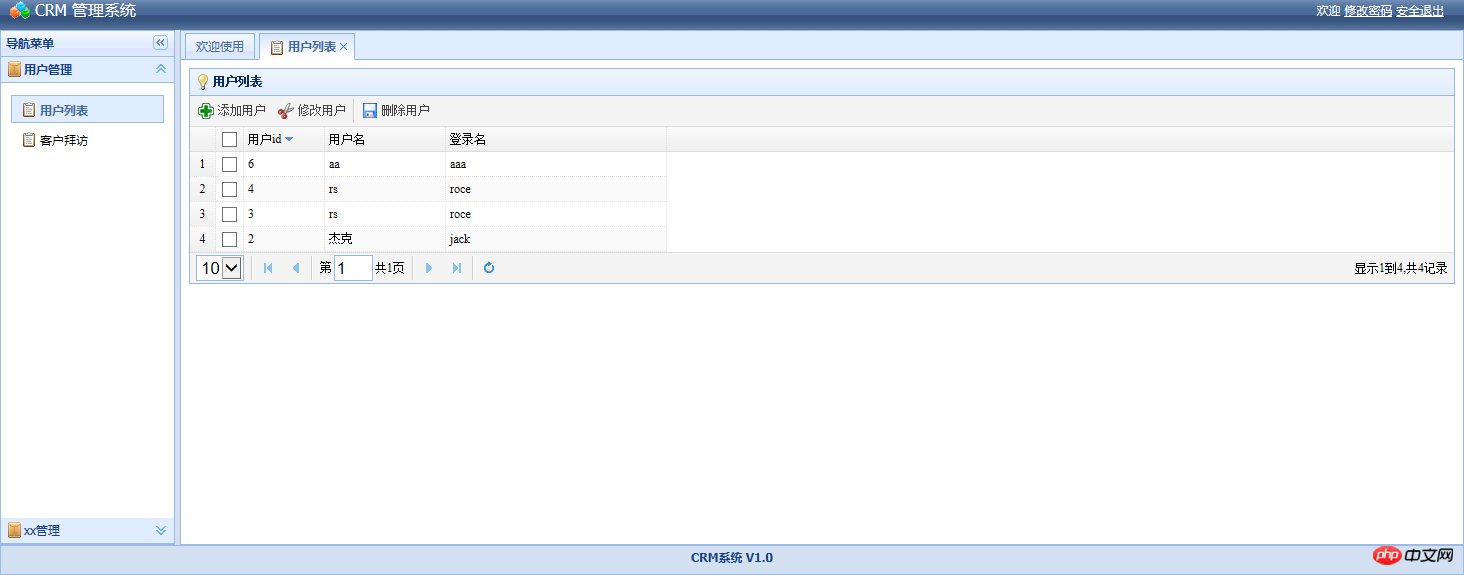
Code:
<!DOCTYPE html PUBLIC "-//W3C//DTD HTML 4.01 Transitional//EN" "http://www.w3.org/TR/html4/loose.dtd"><html><head><meta http-equiv="Content-Type" content="text/html; charset=UTF-8"><title>客户信息管理</title><link rel="stylesheet" type="text/css" href="../ui/themes/default/easyui.css?1.1.11"><link rel="stylesheet" type="text/css" href="../ui/themes/icon.css?1.1.11"><script type="text/javascript" src="../ui/jquery.min.js?1.1.11"></script><script type="text/javascript" src="../ui/jquery.easyui.min.js?1.1.11"></script><script type="text/javascript" src="../ui/locale/easyui-lang-zh_CN.js?1.1.11"></script><script>//点击提交按钮触发该方法提交表单
function submitForm(){
// submit the form
$('#ff').submit();
}

        $(function(){
            //-------------------------------------------------------------------------
            $('#w').window('close'); //页面加载完成,确保窗口关闭
            //-------------------------------------------------------------------------
            $('#ff').form({
                url:'${pageContext.request.contextPath}/UserAction_regist',
                onSubmit: function(){
                    // do some check
                    // return false to prevent submit;
                    return true;//让表单直接提交
                },
                success:function(data){ //提交成功后调用的方法
                    $('#w').window('close');//提交成功关闭窗口
                    $('#test').datagrid('reload'); //提交成功,重新加载列表数据
                    $('#ff').form('clear');//提交成功后,清空表单
                }
            });


            //--------------------------------------------------------------------------
            $('#test').datagrid({
                title:'用户列表', //表格标题
                singleSelect:true, //只允许单选
                iconCls:'icon-tip',//表格标题图标
                //width:700, //宽度
                //height:350, //高度
                nowrap: true,//某列数据较长时,是否需要换行
                striped: true,//是否隔行变色
                collapsible:false,//是否可以折叠表格
                url:'${pageContext.request.contextPath}/UserAction_list',//指定表格数据加载的路径
                sortName: 'user_id',//指定可以使用哪列进行排序
                sortOrder: 'desc',//指定默认排序规则 asc/desc
                remoteSort: false,//是否支持远程
                idField:'user_id', //那一列是id列
                frozenColumns:[[
                    {field:'ck',checkbox:true},
                    {title:'用户id',field:'user_id',width:80,sortable:true}
                ]],
                columns:[[
                    {field:'user_name',title:'用户名',width:120},
                    {field:'user_code',title:'登录名',width:220}
                ]],
                pagination:true,
                rownumbers:true,
                toolbar:[{ //配置工具栏
                    id:'btnadd',
                    text:'添加用户',
                    iconCls:'icon-add',
                    handler:function(){
                        $('#btnsave').linkbutton('enable');
                        //打开前清空表单
                        $('#ff').form('clear');
                        //打开表单窗口
                        $('#w').window('open');
                    }
                },{
                    id:'btncut',
                    text:'修改用户',
                    iconCls:'icon-cut',
                    handler:function(){
                        $('#btnsave').linkbutton('enable');
                        //获得被选中的用户的id
                        var user_id = getSelected();

                        if(!user_id){
                            alert("请选择用户!");
                            return;
                        }
                        //根据id回显数据
                        $('#ff').form('load','${pageContext.request.contextPath}/UserAction_toEdit?user_id='+user_id);
                        //清空密码输入框

                        //打开编辑窗口
                        $('#w').window('open');

                    }
                },'-',{
                    id:'btnsave',
                    text:'删除用户',
                    disabled:false, //禁用属性
                    iconCls:'icon-save',
                    handler:function(){
                        $('#btnsave').linkbutton('enable');//点击后按钮是否可以继续点击
                        //获得被选中的用户id
                        //获得被选中的用户的id
                        var user_id = getSelected();
                        //判断id不能为空
                        if(!user_id){
                            alert("请选择用户!");
                            return;
                        }
                        //调用ajax异步发送请求删除用户
                        $.get("${pageContext.request.contextPath}/UserAction_delete?user_id="+user_id, function(data){
                                //删除成功后,刷新列表
                             $('#test').datagrid('reload'); //提交成功,重新加载列表数据
                            });
                    }
                }]
            });
            var p = $('#test').datagrid('getPager');
            $(p).pagination({
                onBeforeRefresh:function(){
                    alert('before refresh');
                }
            });
        });
        function resize(){
            $('#test').datagrid('resize', {
                width:700,
                height:400
            });
        }
        //获得被选中的
        function getSelected(){
            var selected = $('#test').datagrid('getSelected');
            if (selected){
                return selected.user_id;
            }
        }
        function getSelections(){
            var ids = [];
            var rows = $('#test').datagrid('getSelections');
            for(var i=0;i<rows.length;i++){
                ids.push(rows[i].code);
            }
            alert(ids.join(':'));
        }
        function clearSelections(){
            $('#test').datagrid('clearSelections');
        }
        function selectRow(){
            $('#test').datagrid('selectRow',2);
        }
        function selectRecord(){
            $('#test').datagrid('selectRecord','002');
        }
        function unselectRow(){
            $('#test').datagrid('unselectRow',2);
        }
        function mergeCells(){
            $('#test').datagrid('mergeCells',{
                index:2,
                field:'addr',
                rowspan:2,
                colspan:2
            });
        }
    </script></head><body><table id="test"></table><!-- --------------------------------------------------------------------------- --><div id="w" class="easyui-window" title="My Window" iconCls="icon-save" style="width:500px;height:200px;padding:5px;"><div style="background:#fafafa;padding:10px;width:300px;height:300px;"><form id="ff" method="post" novalidate><input  type="hidden" name="user_id"  ><div><label for="name">登陆名称:</label><input class="easyui-validatebox" type="text" name="user_code" required="true"></input></div><div><label for="name">登陆密码:</label><input class="easyui-validatebox" type="password" name="user_password" id="user_password"  required="true"></input></div><div><label for="name">用户昵称:</label><input class="easyui-validatebox" type="text" name="user_name" required="true"></input></div><div><input type="button" value="提交" onclick="submitForm();" ></div></form></div></div></body></html>
The above is the detailed content of Example analysis: statistical information management, Spring annotation development and EasyUI. For more information, please follow other related articles on the PHP Chinese website!

Hot AI Tools

Undresser.AI Undress
AI-powered app for creating realistic nude photos

AI Clothes Remover
Online AI tool for removing clothes from photos.

Undress AI Tool
Undress images for free

Clothoff.io
AI clothes remover

Video Face Swap
Swap faces in any video effortlessly with our completely free AI face swap tool!

Hot Article
Hot Tools

Notepad++7.3.1
Easy-to-use and free code editor

SublimeText3 Chinese version
Chinese version, very easy to use

Zend Studio 13.0.1
Powerful PHP integrated development environment

Dreamweaver CS6
Visual web development tools

SublimeText3 Mac version
God-level code editing software (SublimeText3)
Hot Topics
 1386
1386
 52
52

 How to implement data statistics and analysis in uniapp
Oct 24, 2023 pm 12:37 PM
How to implement data statistics and analysis in uniapp
Oct 24, 2023 pm 12:37 PM
How to implement data statistics and analysis in uniapp 1. Background introduction Data statistics and analysis are a very important part of the mobile application development process. Through statistics and analysis of user behavior, developers can have an in-depth understanding of user preferences and usage habits. Thereby optimizing product design and user experience. This article will introduce how to implement data statistics and analysis functions in uniapp, and provide some specific code examples. 2. Choose appropriate data statistics and analysis tools. The first step to implement data statistics and analysis in uniapp is to choose the appropriate data statistics and analysis tools.
 How to use SQL statements for data aggregation and statistics in MySQL?
Dec 17, 2023 am 08:41 AM
How to use SQL statements for data aggregation and statistics in MySQL?
Dec 17, 2023 am 08:41 AM
How to use SQL statements for data aggregation and statistics in MySQL? Data aggregation and statistics are very important steps when performing data analysis and statistics. As a powerful relational database management system, MySQL provides a wealth of aggregation and statistical functions, which can easily perform data aggregation and statistical operations. This article will introduce the method of using SQL statements to perform data aggregation and statistics in MySQL, and provide specific code examples. 1. Use the COUNT function for counting. The COUNT function is the most commonly used
 Implementation of linear and pie chart functions in Vue statistical charts
Aug 19, 2023 pm 06:13 PM
Implementation of linear and pie chart functions in Vue statistical charts
Aug 19, 2023 pm 06:13 PM
The linear and pie chart functions of Vue statistical charts are implemented in the field of data analysis and visualization. Statistical charts are a very commonly used tool. As a popular JavaScript framework, Vue provides convenient methods to implement various functions, including the display and interaction of statistical charts. This article will introduce how to use Vue to implement linear and pie chart functions, and provide corresponding code examples. Linear graph function implementation A linear graph is a type of chart used to display trends and changes in data. In Vue, we can use some excellent
 Use Google Analytics to count website data in Beego
Jun 22, 2023 am 09:19 AM
Use Google Analytics to count website data in Beego
Jun 22, 2023 am 09:19 AM
With the rapid development of the Internet, the use of Web applications is becoming more and more common. How to monitor and analyze the usage of Web applications has become a focus of developers and website operators. Google Analytics is a powerful website analytics tool that can track and analyze the behavior of website visitors. This article will introduce how to use Google Analytics in Beego to collect website data. 1. To register a Google Analytics account, you first need to
 Steps of statistical analysis
Jun 28, 2023 pm 03:27 PM
Steps of statistical analysis
Jun 28, 2023 pm 03:27 PM
Statistical analysis often refers to the process of sorting, classifying and interpreting collected relevant data. The basic steps of statistical analysis include: 1. Collect data; 2. Organize data; 3. Analyze data.
 How to quickly build a statistical chart system under the Vue framework
Aug 21, 2023 pm 05:48 PM
How to quickly build a statistical chart system under the Vue framework
Aug 21, 2023 pm 05:48 PM
How to quickly build a statistical chart system under the Vue framework. In modern web applications, statistical charts are an essential component. As a popular front-end framework, Vue.js provides many convenient tools and components that can help us quickly build a statistical chart system. This article will introduce how to use the Vue framework and some plug-ins to build a simple statistical chart system. First, we need to prepare a Vue.js development environment, including installing Vue scaffolding and some related plug-ins. Execute the following command in the command line
 How to use MySQL's COUNT function to count the number of rows in a data table
Jul 25, 2023 pm 02:09 PM
How to use MySQL's COUNT function to count the number of rows in a data table
Jul 25, 2023 pm 02:09 PM
How to use MySQL's COUNT function to count the number of rows in a data table. In MySQL, the COUNT function is a very powerful function that is used to count the number of rows in a data table that meet specific conditions. This article will introduce how to use MySQL's COUNT function to count the number of rows in a data table, and provide relevant code examples. The syntax of the COUNT function is as follows: SELECTCOUNT(column_name)FROMtable_nameWHEREconditi
 Do you know how to count people in excel?
Mar 20, 2024 pm 01:30 PM
Do you know how to count people in excel?
Mar 20, 2024 pm 01:30 PM
As one of the commonly used office software, Excel is an indispensable good partner in our life and work. We often use it to count people, which is also the most common operation. For veterans who are familiar with Excel, using it to count people is a matter of minutes; but if you are a novice, using ecxel to count people is simply difficult! So how to use it? I compiled a document today, I hope it can help you! Let’s take a look together! Method 1: [Use functions to count people] (as shown in the picture) We enter [=COUNT(B2:B6)] in the bottom unit cell; then, press [Enter] to get the number of people. Method 2: [Use the status bar to count people] (as shown in the picture). 1. We click the mouse
