
In website and front-end development, JavaScript is a powerful scripting language, but many people love and hate it, and sometimes directly ignore its importance. Of course, there are many ways to debug js. Firebug under ff and ie also have very powerful debugging tools. Here I will show you how to debug js in chrome.
1. Open the demo with chrome browser
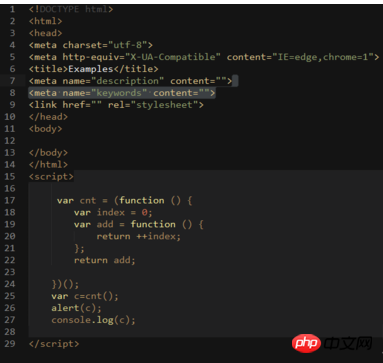
2. Press the f12 key
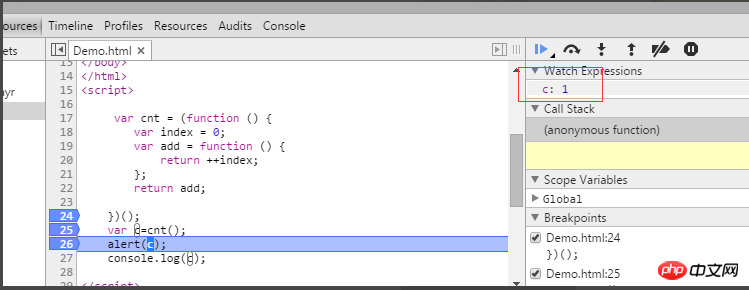
##3. Add breakpoint

4. Monitor variables

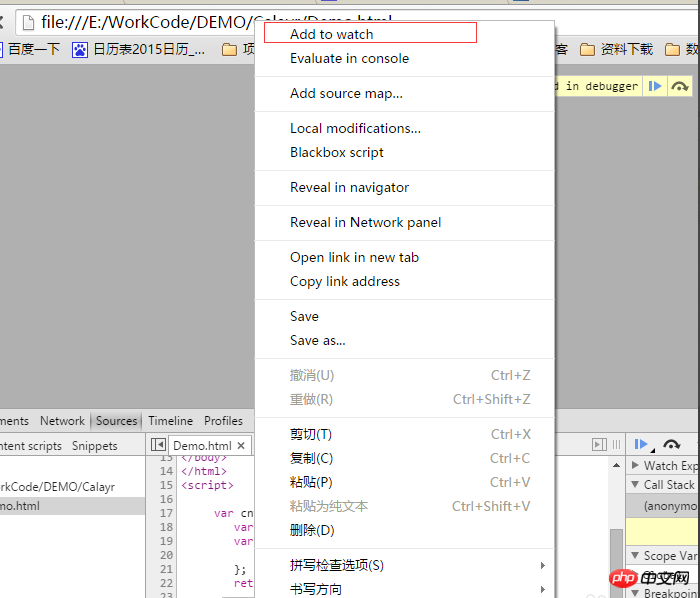
5. Check the console input log

6.demo code:
<!DOCTYPE html>
<html>
<head>
<meta charset="utf-8">
<meta http-equiv="X-UA-Compatible" content="IE=edge,chrome=1">
<title>Examples</title>
<meta name="description" content="">
<meta name="keywords" content="">
<link href="" rel="stylesheet">
</head>
<body>

</body>
</html>
<script>

     var cnt = (function () {
        var index = 0;
        var add = function () {
            return ++index;
        };
        return add;

    })();
    var c=cnt();
    alert(c);
    console.log(c);

</script>The above is the detailed content of Example of how Chrome debugs JavaScript. For more information, please follow other related articles on the PHP Chinese website!


