This article mainly introduces how to debug JS through an adder. First enter the code:
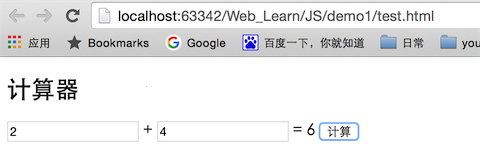
Effect:

test.html:
<span style="font-family:Comic Sans MS;font-size:18px;"><!DOCTYPE html>
<html lang="en">
<head>
  <meta charset="UTF-8">
  <title>计算器</title>
</head>
<body>

<div>
  <h2>计算器</h2>

  <div>
    <input type="text" id="num1">
    <span>+</span>
    <input type="text" id="num2">
    <span>=</span>
    <span id="result"></span>
    <button id="add">计算</button>
  </div>
</div>
<script src="./demo.js"></script>
</body>
</html></span> demo.js
<span style="font-family:Comic Sans MS;font-size:18px;">/**
 * Created by yanzi on 15/12/8.
 */
var num1 = document.getElementById("num1"),
  num2 = document.getElementById("num2"),
  result = document.getElementById("result"),
  btn_add = document.getElementById("add");

btn_add.addEventListener("click", onAddClick, false);
function onAddClick(){
  var a = parseInt(num1.value),
  b = parseInt(num2.value);
  var sum = add(a, b);
  result.innerHTML = sum;
}

/**
 *
 * @param a
 * @param b
 * @returns {*}
 */
function add(a, b){
  return a+b;
}</span>
Key summary:
1. Generally when debugging JS, there are three types of printing information:
a. Use alert, the disadvantage is that the box pops up every time
b. Use console.log, the amount of data is small and it’s okay
c. Add breakpoints for debugging
2. In JS, if var is added in front of a variable, it means a local variable. If there is no var in the function, it means a global variable. Therefore, variables are usually preceded by var.
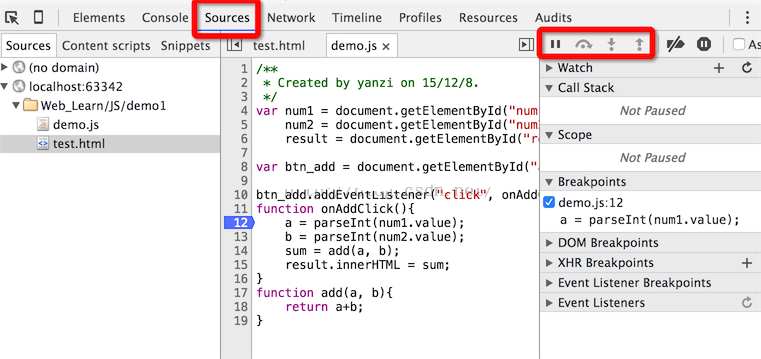
3. Generally in the chrome debugger, look at the code in elements and debug in the source directory. In this mode, you can add breakpoints by clicking on each line in js.

4. The four rightmost buttons in debugging mode are: next breakpoint, single-step execution, enter the next function, and jump out of the function. Basically all debugging tools have these four types.

5. In breakpoint mode, you can see the current value by entering a variable in the console, and you can modify the value at will.

The above are the specific steps for js debugging. I hope you will use js for debugging when designing javascript programs. Thank you for reading.


