

Graphical introduction to how to use Debug in Intellij IDEA

Debug is used to track the running process of the code. Usually exceptions occur during the running of the program. Enabling Debug mode can analyze and locate the location of the exception and the changes in parameters during the running process. Usually we can also enable Debug mode to track the running process of the code and learn the source code of the third-party framework.
So let’s learn how to use Debug in Intellij IDEA, mainly including the following content:
1. The beginning of Debug
2. Basic usage & shortcut keys
3, variable View
4. Calculation expression
五, smart step enters
## Six, breakpoint conditions settings## Seven, multi -threaded Debugging
8. Rollback Breakpoint
9. Interrupt Debug
10. Attachment: JRebel Activation
1. Debug Opening
First, let’s take a look at the interface in Debug mode in IDEA.
The following is the interface after starting the Debug mode in IDEA and entering the breakpoint. This is Windows, and the icons may be slightly different from the Mac icons. Let’s simply talk about the 8 places marked in the picture below:
① Start the service in Debug mode, and a button on the left starts it in Run mode. During development, I usually start the Debug mode directly to facilitate debugging the code at any time.
② Breakpoint: Left-click in the line number column on the left, or use the shortcut key Ctrl+F8 to set/cancel a breakpoint. The color of the breakpoint line can be set by yourself.
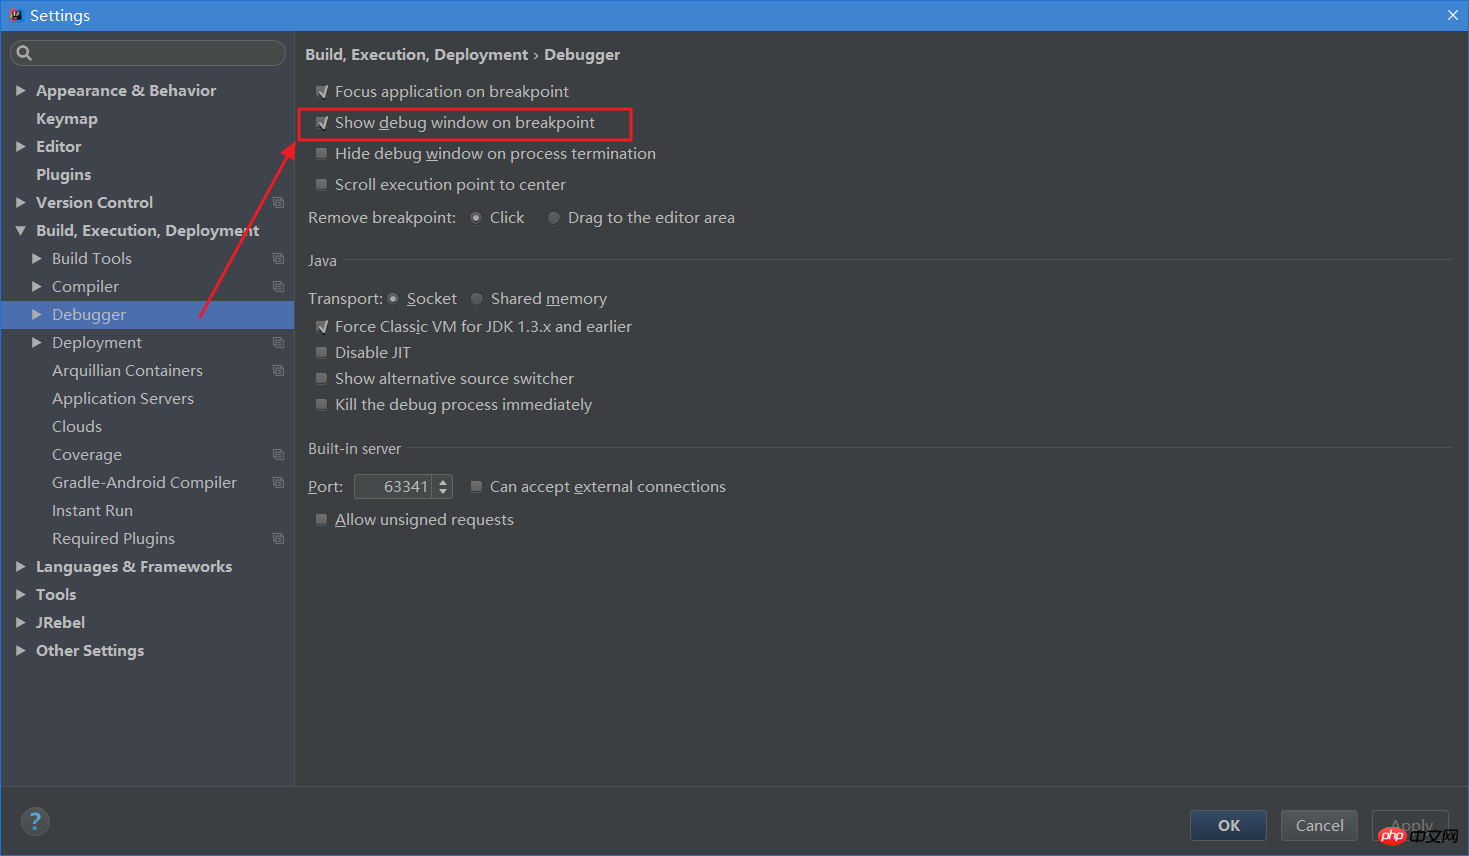
③ Debug window: After the access request reaches the first breakpoint, the Debug window will be automatically activated. If it is not activated automatically, you can go to settings to set it, as shown in Figure 1.2.
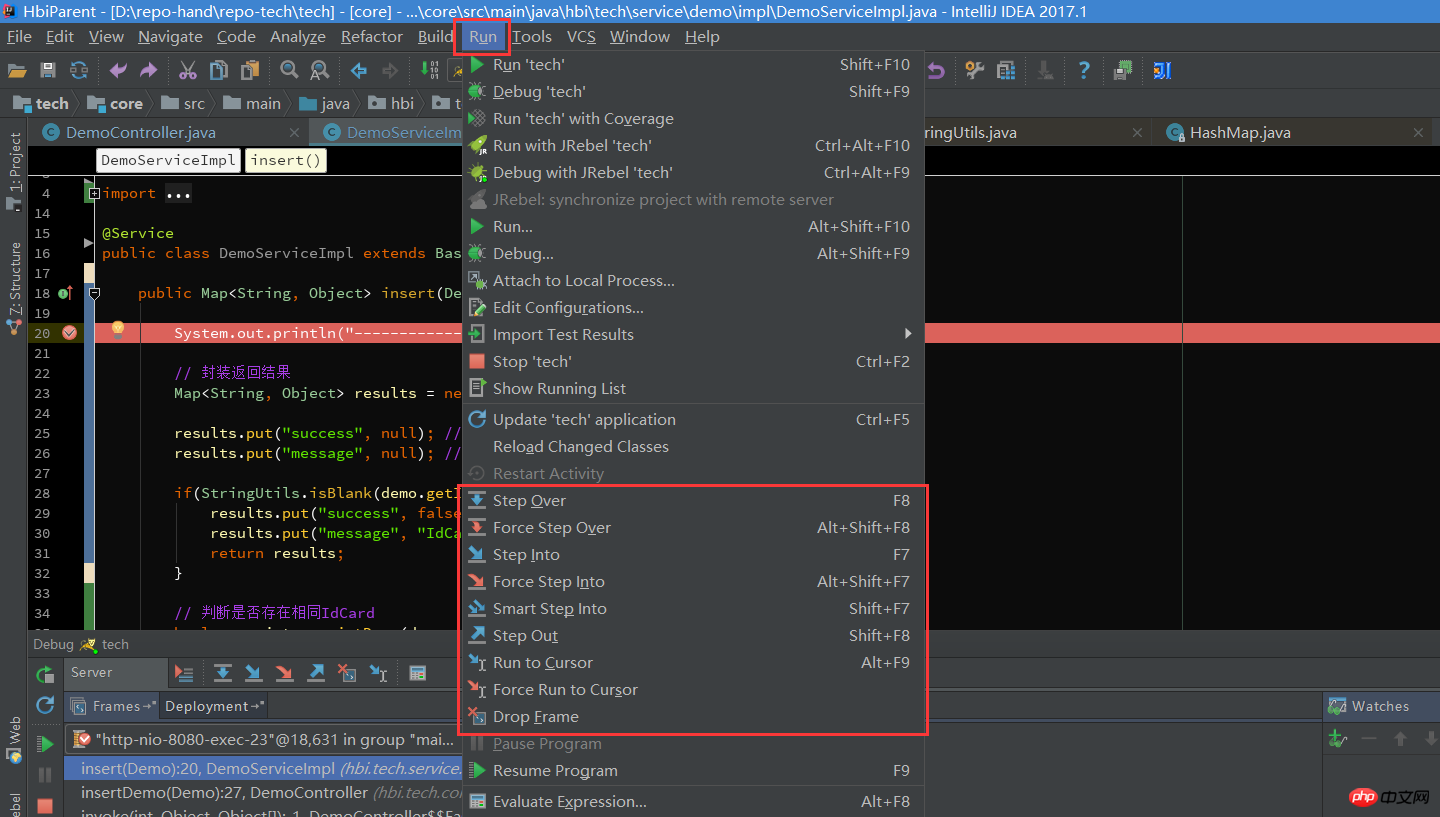
④ Debugging buttons: There are 8 buttons in total. The main functions of debugging correspond to these buttons. You can view the corresponding shortcut keys by hovering the mouse over the buttons. The same corresponding functions can be found in the menu bar Run, as shown in Figure 1.4.
⑤ Service button: You can close/start services, set breakpoints, etc. here.
⑥Method call stack: All the methods passed by the thread for debugging are displayed here. If you check the [Show All Frames] button in the upper right corner, the methods of other class libraries will not be displayed, otherwise there will be a Lots of methods.
⑦ Variables: In the variable area, you can view the variables in the current method before the current breakpoint.
⑧ Watches: To view variables, you can drag the variables in the Variables area to Watches to view them
[Figure 1.1]
 [ Figure 1.2]: Check Show debug window on breakpoint in the settings, and the Debug window will be automatically activated after the request enters the breakpoint
 [Figure 1.3]: If your IDEA There is no toolbar or status bar displayed at the bottom. It can be opened in View. Displaying the toolbar will facilitate our use. You can try these four options yourself.
 [Figure 1.4]: There are debugging corresponding functions in the menu bar Run, and you can view the corresponding shortcut keys.
2. Basic Usage & Shortcut Keys
The debug function mainly corresponds to the two groups of buttons 4 and 5 in Figure 1. :
1. Let’s talk about the first group of buttons first. There are 8 buttons in total. They are as follows from left to right: Execution Point (Alt + F10): If your cursor is on another line or page, click this button to jump to the line where the current code is executed.
> Step Over (F8): Step over, go down line by line. If there is a method on this line, you will not enter the method.
> Step Into (F7): Step into. If there is a method in the current line, you can enter the method. It is generally used to enter the custom method and will not enter the official class library method, such as line 25. put method. 
2. The second group of buttons, a total of 7 buttons, are as follows from top to bottom:
[Figure 2.2]


## During the debugging process, it is very necessary to track and view changes in variables. Here is a brief introduction to several places where variables can be viewed in IDEA. I believe most people understand it.
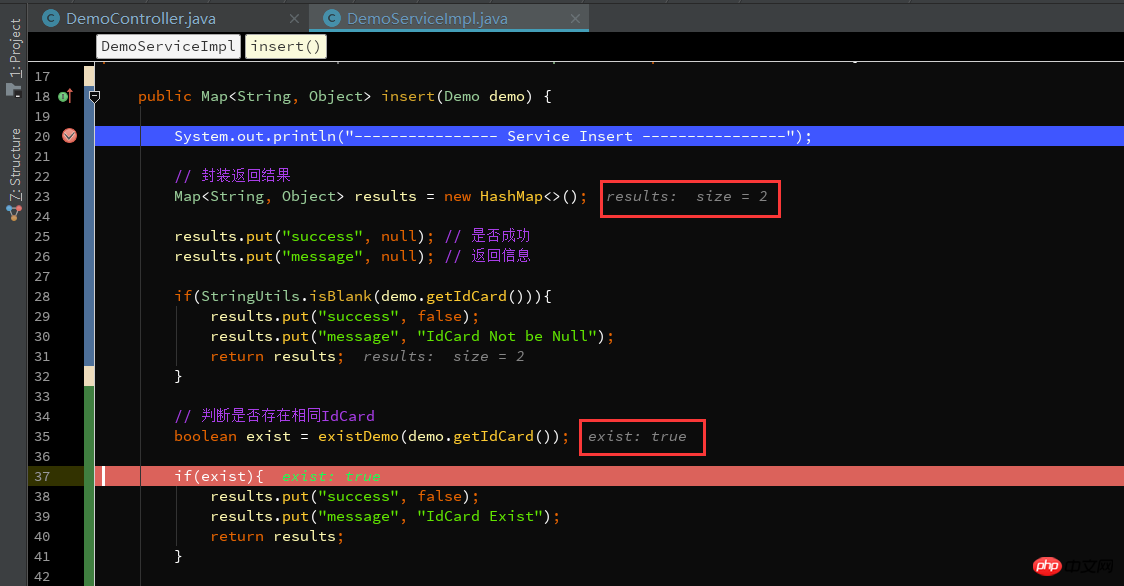
1. As follows, in IDEA, the value of the current variable will be displayed after the line where the parameter is located.
[Figure 3.1]
 2. Hover the cursor over the parameter to display the current variable information. Click to open the details as shown in Figure 3.3. I usually use this method, it's quick and convenient.
[Figure 3.2]

 3. View in Variables, which displays all variables in the current method.
[Figure 3.4]
 4. In Watches, click New Watch and enter the variables you want to view. Or you can drag it from Variables to Watche to view it.
[Picture 3.5]
 If you find that you don’t have Watches, it may be where the picture below is.
[Figure 3.6]


IV. Calculation expression
The previously mentioned calculation expression is shown in the button in Figure 4.1, Evaluate Expression (Alt + F8). You can use this operation to calculate the value of an expression during debugging without printing the information.
[Figure 4.1]
 1. Press Alt + F8 or the button, or you can select an expression and then Alt + F8 to pop up the window to calculate the expression, as follows , press Enter or click Evaluate to calculate the value of the expression.
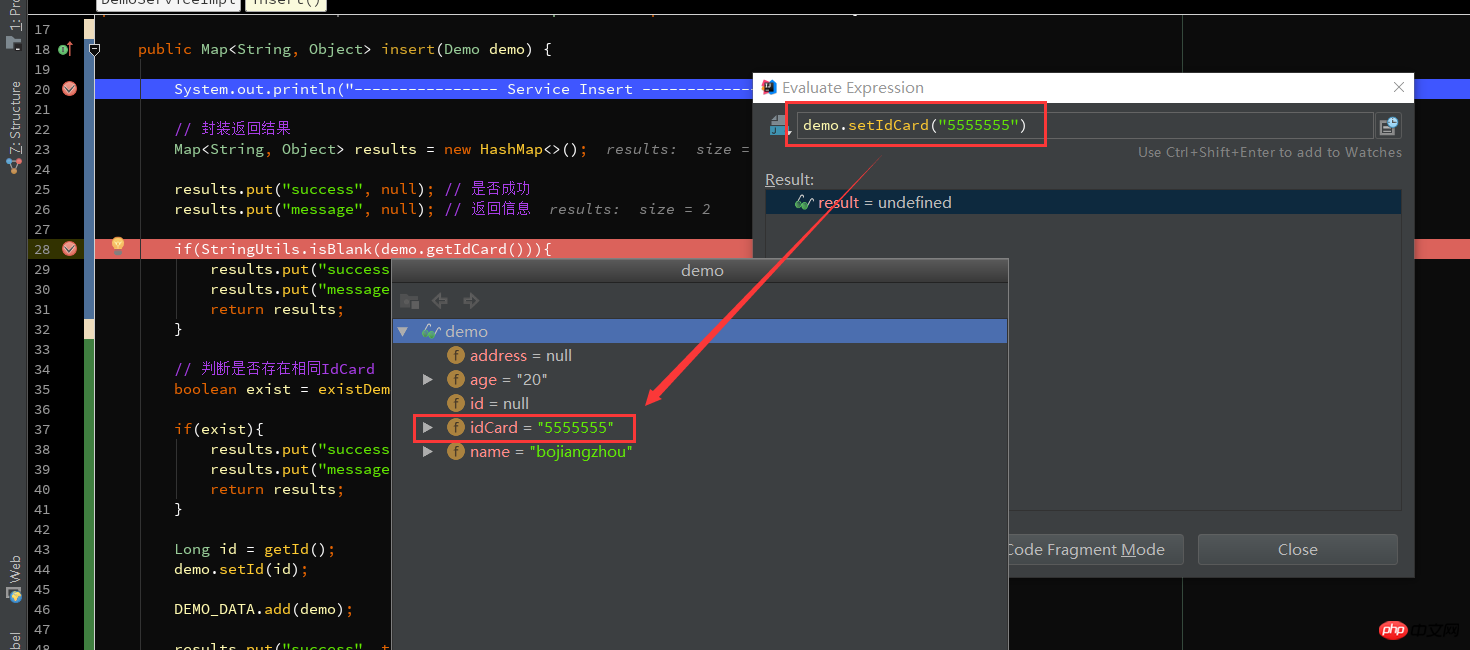
This expression can not only be a general variable or parameter, but also a method. When you call several methods in a line of code, you can view the return value of a method in this way.
 [Figure 4.2]
2. Set variables. In the calculation expression box, you can change the value of the variable, which sometimes makes it convenient for us to debug various It's not worth it.
 [Figure 4.3]
5. Smart Step
Think about it, there are several methods in a line of code, how can you only choose Enter in a certain way. I mentioned before that you can use Step Into (Alt + F7) or Force Step Into (Alt + Shift + F7) to enter the method, but these two operations will be entered sequentially according to the method calling order, which is more troublesome.
Then Smart Step Into is very convenient, Smart Step Into, this function can be seen in Run, Smart Step Into (Shift + F7), as shown in Figure 5.1
 [ Figure 5.1]
Press Shift + F7, it will automatically locate the current breakpoint line and list the methods that need to be entered. As shown in Figure 5.2, click the method to enter the inside of the method.
If there is only one method, enter directly, similar to Force Step Into.
 [Figure 5.2]
6. Breakpoint condition setting
By setting breakpoint conditions, the system will stop when the conditions are met. at breakpoint, otherwise run directly.
Usually, when we are traversing a relatively large collection or array, we set a breakpoint within the loop. Do we have to look at the values of the variables one by one? It must be tiring, and maybe you missed it and it’s worth doing it again.
1. Right-click on the breakpoint to directly set the conditions of the current breakpoint, as shown in Figure 6.1. The breakpoint will only take effect when I set exist to true.
 [Figure 6.1]
2. Click View Breakpoints (Ctrl + Shift + F8) to view all breakpoints.
Java Line Breakpoints displays all breakpoints. Check Condition on the right to set the breakpoint conditions.
If you check Log message to console, the current breakpoint line will be output to the console, as shown in Figure 6.3
If you check Evaluate and log, you can calculate the expression when executing this line of code value and output the result to the console.
[Picture 6.2]

[Picture 6.3]

3. Let’s talk about the one on the right Filters filter, these are not commonly used in general, let’s briefly explain their meaning.
Instance filters: Instance filtering, enter the instance ID (instance ID in Figure 6.5), but I didn’t succeed here. I don’t know why. Friends who know it can leave a message.
Class filters: Class filtering, filtering based on class name, also failed....
Pass count: used in loops, if the breakpoint is in the loop, you can set this value, After how many times the loop stops at the breakpoint, subsequent loops will stop at the breakpoint.
[Figure 6.4]

[Figure 6.5]

4. Exception breakpoint, By setting exception breakpoints, when an exception that needs to be intercepted occurs in the program, the exception line will be automatically located.
As shown in Figure 6.6, click the + sign to add Java Exception Breakpoints and add exception breakpoints. Then enter the exception class that requires breakpoints, as shown in Figure 6.7. You can then see the added exception breakpoints in Java Exception Breakpoints.
I have added a NullPointerException breakpoint here, as shown in Figure 6.8. After a null pointer exception occurs, it is automatically located at the null pointer exception line.
[Picture 6.6]

[Picture 6.7]

[Picture 6.8]

7. Multi-thread debugging
Normally when we debug, we do it in one thread and go down step by step. But sometimes you will find that when debugging, you can't even initiate another request?
That’s because IDEA’s default blocking level when debugging is ALL, which will block other threads. Other threads will only run when the current debugging thread finishes. You can select Thread in View Breakpoints, as shown in Figure 7.1, and then click Make Default to set it as the default option.
[Figure 7.1]

To switch threads, in the drop-down list of Frames in Figure 7.1, you can switch the current thread, as shown below I have two here Debug thread, switch to another one and enter another Debug thread.
[Figure 7.1]

8. Rollback breakpoint
When debugging, you want Go through the process again without making another request?
1. First get to know the call stack of this method, as shown in Figure 8.1. First, request to enter the insertDemo method of DemoController, and then call the insert method. We will ignore other invokes. The top method is where the current breakpoint is. Methods.
[Figure 8.1]

2. Breakpoint rollback
The so-called breakpoint rollback is actually a rollback to the previous At the beginning of a method call, the test in IDEA cannot rewind line by line or return to the previous breakpoint, but returns to the previous method.
There are two ways to roll back. One is the Drop Frame button (Figure 8.2), which gradually rolls back according to the method called, including other methods of the third-party class library (cancel the Show All Frames button will display the third-party class Library method, as shown in Figure 8.3).
The second method is to select the method to be rolled back on the call stack method, right-click and select Drop Frame (Figure 8.4), roll back to the previous method call of the method, and then press F9( Resume Program), you can see that the program has entered the breakpoint of this method.
But there is one thing to note. Breakpoint rollback can only go through the process again. If the status of some parameters/data has changed before, it cannot be rolled back to the previous state, such as objects and collections. , updated database data, etc.
Graph[8.2]

Graph[8.3]

Graph[8.4]

9. Interrupting Debug
Want to interrupt the request when debugging and not go through the remaining process?
Sometimes, after we see that the parameters passed in are incorrect, we don’t want to go through the subsequent process. How to interrupt this request (the subsequent process will delete the database data...), is it necessary? Close the service and restart the program? Well, I've done that before.
To be precise, I have not found a way to directly interrupt the request (other than shutting down the service), but you can avoid subsequent processes through Force Return, that is, forced return, as shown in Figure 9.1.
Click Force Return, and the Return Value window pops up. The return type of my method is Map, so I directly return results here to force the return, so that no further steps are performed. Or you can new HashMap<>().
[Picture 9.1]

[Picture 9.2]

10. Attachment: JRebel activation
At present, I have been using JRebel as a hot deployment tool, and the effect is quite satisfactory. Modifying Java code or xml and other configuration files can be hot updated. Occasionally, when the service has been open for a long time, or when many files have been changed, the hot update does not take effect, and the service needs to be restarted.
Here is just a brief description of a way I saw on the Internet to obtain permanent use rights for free (non-cracked). I am not sure when this method will no longer be available.
① First you need a Facebook or Twitter account (Twitter is best)
② Enter this website: https://my.jrebel.com/ and log in, as shown in Figure 10.1
③ Then you can get your permanent activation code in Install and Acticate.
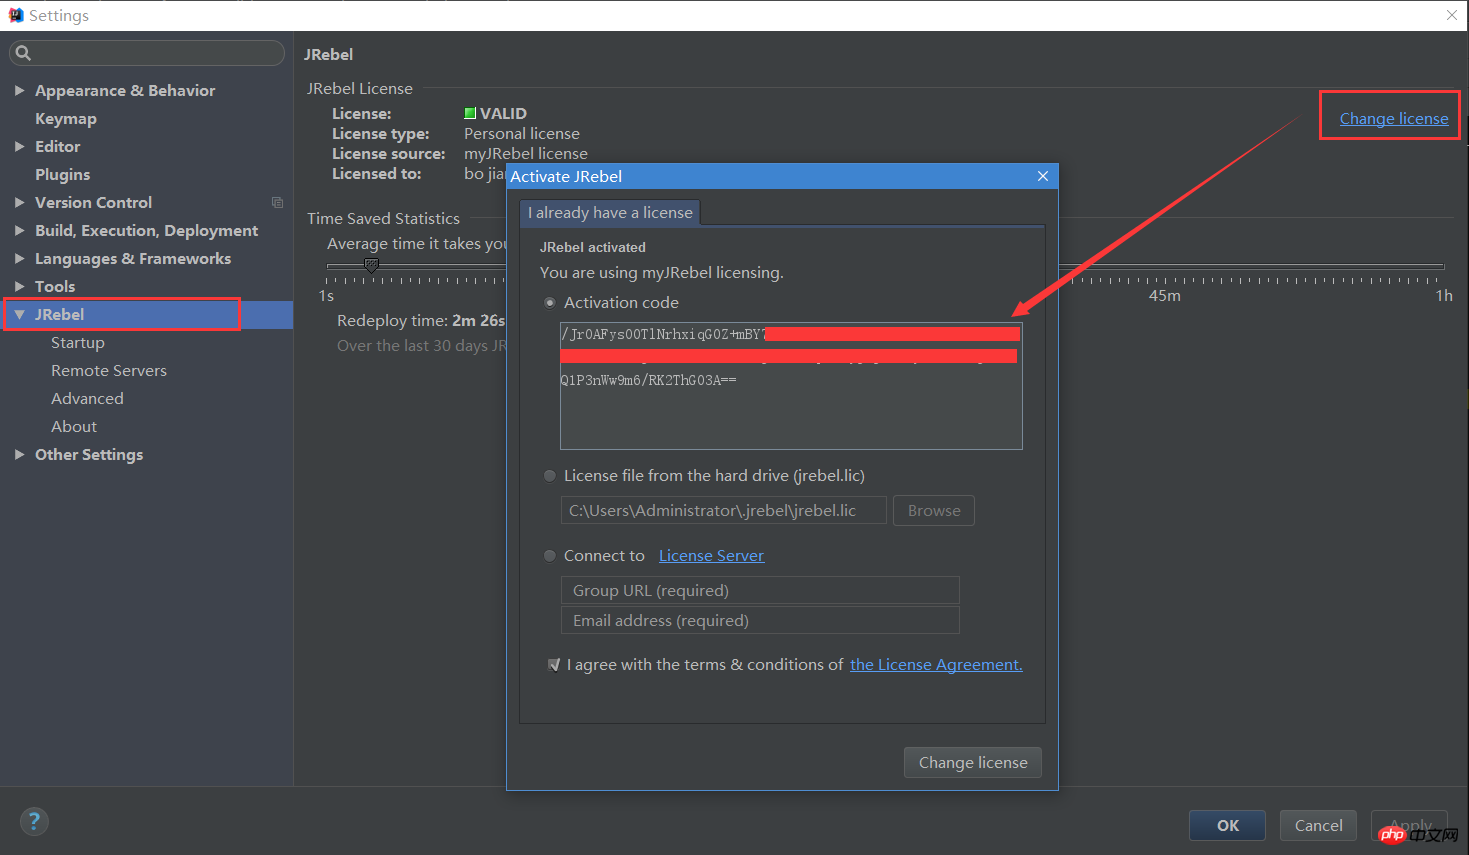
④ Set the activation code in Jrebel in the settings, as shown in Figure 10.3. If the JRebel plug-in is not installed, first search and install the JRebel plug-in in Plugins.
[Figure 10.1]

[Picture 10.2]

[Picture 10.3]
The above is the detailed content of Graphical introduction to how to use Debug in Intellij IDEA. For more information, please follow other related articles on the PHP Chinese website!

Hot AI Tools

Undresser.AI Undress
AI-powered app for creating realistic nude photos

AI Clothes Remover
Online AI tool for removing clothes from photos.

Undress AI Tool
Undress images for free

Clothoff.io
AI clothes remover

Video Face Swap
Swap faces in any video effortlessly with our completely free AI face swap tool!

Hot Article
Hot Tools

Notepad++7.3.1
Easy-to-use and free code editor

SublimeText3 Chinese version
Chinese version, very easy to use

Zend Studio 13.0.1
Powerful PHP integrated development environment

Dreamweaver CS6
Visual web development tools

SublimeText3 Mac version
God-level code editing software (SublimeText3)
Hot Topics
 1387
1387
 52
52

 The difference between idea community version and professional version
Nov 07, 2023 pm 05:23 PM
The difference between idea community version and professional version
Nov 07, 2023 pm 05:23 PM
The differences between IDEA Community Edition and Professional Edition include authorization methods, functions, support and updates, plug-in support, cloud services and team collaboration, mobile development support, education and learning, integration and scalability, error handling and debugging, security and privacy protection. etc. Detailed introduction: 1. Authorization method. The community version is free and suitable for all developers, no matter what operating system is used. The community version supports open source projects and commercial projects. The professional version is paid and suitable for commercial development. The professional version has 30 There is a trial period of three days, after which you need to purchase a license to continue using it, etc.
 Five IntelliJ IDEA plug-ins to write code efficiently
Jul 16, 2023 am 08:03 AM
Five IntelliJ IDEA plug-ins to write code efficiently
Jul 16, 2023 am 08:03 AM
Artificial intelligence AI is currently a widely recognized future trend and development direction. Although some people worry that AI may replace all jobs, in fact it will only replace jobs that are highly repetitive and low-output. Therefore, we should learn to work smarter rather than harder. This article introduces 5 AI-driven Intellij plug-ins. These plug-ins can help you improve productivity, reduce tedious repetitive work, and make your work more efficient and convenient. 1GithubCopilotGithubCopilot is an artificial intelligence code assistance tool jointly developed by OpenAI and GitHub. It uses OpenAI’s GPT model to analyze code context, predict and generate new code
 How to solve the problem of invalid debugging when setting breakpoints in SpringBoot project
May 11, 2023 am 10:49 AM
How to solve the problem of invalid debugging when setting breakpoints in SpringBoot project
May 11, 2023 am 10:49 AM
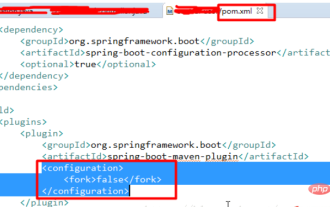
I am new to the springboot project. (1) I found that breakpoint debugging was ineffective. I was very depressed and searched for solutions online. All I saw were some very complicated solutions, which were said to be remote debugging, but also required additional opening slogans. This is different from a traditional project, so I don’t think it’s necessary. So after some exploration, I found that there is a simpler way. The steps are as follows: Add a configuration in the plugin part of the pom file: false and it will be ok; (2) Regarding the error in the SpringBoot project that the web.xml file is missing, because Traditional web projects require web.xml files, but SpringBoot projects do not require web.xml files.
 Idea how to start multiple SpringBoot projects
May 28, 2023 pm 06:46 PM
Idea how to start multiple SpringBoot projects
May 28, 2023 pm 06:46 PM
1. Preparation Use Idea to build a helloworld SpringBoot project. Development environment description: (1) SpringBoot2.7.0 (2) Idea: IntelliJIDEA2022.2.2 (3) OS: The MacOS environment is different. Some operations are slightly different, but the overall idea is the same. 2. Start multiple SpringBoot2.1 Solution 1: Modify the port of the configuration file In the SpringBoot project, the port number can be configured in the configuration file, so the simplest solution that can be thought of is to modify the port of the configuration file application.(properties/yml) Configurations
 How to solve the problem of empty mapper automatically injected into idea springBoot project
May 17, 2023 pm 06:49 PM
How to solve the problem of empty mapper automatically injected into idea springBoot project
May 17, 2023 pm 06:49 PM
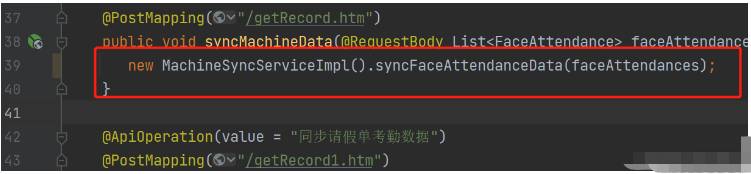
In the SpringBoot project, if MyBatis is used as the persistence layer framework, you may encounter the problem of mapper reporting a null pointer exception when using automatic injection. This is because SpringBoot cannot correctly identify the Mapper interface of MyBatis during automatic injection and requires some additional configuration. There are two ways to solve this problem: 1. Add annotations to the Mapper interface. Add the @Mapper annotation to the Mapper interface to tell SpringBoot that this interface is a Mapper interface and needs to be proxied. An example is as follows: @MapperpublicinterfaceUserMapper{//...}2
 What software is idea?
Sep 02, 2022 pm 05:05 PM
What software is idea?
Sep 02, 2022 pm 05:05 PM
Idea is a Java integrated development environment tool software developed by JetBrains Software Company. IDEA advocates intelligent coding, and its special functions include: intelligent selection, coding assistance, flexible typesetting, dynamic syntax detection, code inspection, full support for JSP, preset templates, perfect support for version control, intelligent code, etc.
 How to solve the problem that Springboot hot deployment is invalid in Idea
May 18, 2023 pm 06:01 PM
How to solve the problem that Springboot hot deployment is invalid in Idea
May 18, 2023 pm 06:01 PM
一、开启idea自动make功能1-EnableAutomakefromthecompilerPRESS:CTRL+SHIFT+ATYPE:makeprojectautomaticallyPRESS:EnterEnableMakeProjectautomaticallyfeature2-EnableAutomakewhentheapplicationisrunningPRESS:CTRL+SHIFT+ATYPE:RegistryFindthekeycompiler.automake.allow.
 How to debug Java Stream operations in IntelliJ IDEA
May 09, 2023 am 11:25 AM
How to debug Java Stream operations in IntelliJ IDEA
May 09, 2023 am 11:25 AM
Stream operation is a highlight of Java8! Although java.util.stream is very powerful, there are still many developers who rarely use it in actual work. One of the most complained reasons is that it is difficult to debug. This was indeed the case at the beginning, because streaming operations such as stream cannot be used in DEBUG When it is one line of code, when it comes to the next step, many operations are actually passed at once, so it is difficult for us to judge which line in it is the problem. Plug-in: JavaStreamDebugger If the IDEA version you are using is relatively new, this plug-in is already included and does not need to be installed. If it is not installed yet, install it manually and then continue below.
