

Use MySQL to analyze SQL time-consuming issues
Slow log query
MySQL's slow log query is a log record provided by MySQL. It records statements whose response time exceeds the threshold in MySql. Specifically, SQL that takes longer than the long_query_time value will be recorded in the slow log. The default time of long_query_time is 10, which means running more than 10 statements.
For example, if a SQL statement takes more than 5 seconds to execute, even if it is a slow SQL statement, MySQL will record the SQL statement that exceeds 5 seconds. We can conduct a comprehensive analysis in conjunction with explain.
By default, the MySQL database does not enable slow query logs, and we need to set this parameter manually. Of course, if it is not required for tuning, it is generally not recommended to enable this parameter, because slow logging will more or less have a certain performance impact.
Whether it is enabled and set
#查看是否开启show variables like '%slow_query_log%';#开启set global slow_query_log = 1;
Using set global slow_query_log=1 to enable the slow query log will only take effect on the current database and will become invalid if MySQL is restarted. If you want it to take effect permanently, you must modify the configuration file my.cnf.
Note that after setting the slow query threshold time, you may not see the value change, that is, it does not take effect. In this case, you need to reconnect or open a new session to see the modified value.
show variables like '%long_query_time%'
Or you can use the following command without reopening the connection:
show variables like '%long_query_time%'
Which sql will be recorded by slow log, which is controlled by long_query_time. By default, the value of long_query_time is 10 seconds. , command:
show variables like '%long_query_time%';
If the running time is exactly equal to long_query_time, it will not be recorded. In other words, in mysql, it is judged to be greater than long_query_time, not greater than or equal to.
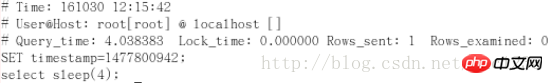
You can use the following statement to do a test
SELECT sleep(4)
If you set long_query_time to 3 seconds, then this statement will be recorded.
View the number of slow logs
show global status like '%slow_queries%'
Log analysis tool mysqldumpslow
In the production environment, if you want to manually analyze the log, find, Analyzing SQL is obviously a laborious task. MySql provides the log analysis tool mysqldumpslow.
For example:
#得到返回记录集最多的10个SQL
Mysqldumpslow –s r –t 10 D:\Program Files\mysql\data\DESKTOP-VN2D5OU-slow.log#得到访问次数最多的10个SQL
Mysqldumpslow –s c –t 10 D:\Program Files\mysql\data\DESKTOP-VN2D5OU-slow.log#得到按照时间排序的前10条里面含有左连接的查询
Mysqldumpslow –s t –t 10 –g “left join” D:\Program Files\mysql\data\DESKTOP-VN2D5OU-slow.log#另外建议在使用这些命令时结合|和more使用,否则可能出现爆破情况
Mysqldumpslow –s r –t 10 D:\Program Files\mysql\data\DESKTOP-VN2D5OU-slow.log|more
参数含义
s: 表示按照何种方式排序
c:访问次数
l:锁定时间
r:返回记录
t:查询时间
al:平均锁定时间
t:返回前面多少条的数据
g:后面搭配一个正则表达式
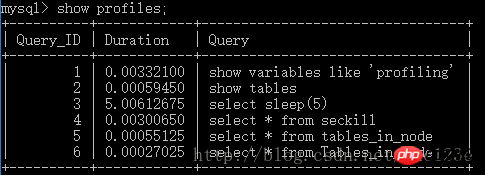
Use show profile for sql analysis
The show profile command can analyze the resource consumption of statement execution in the current session. Used to find SQL time-consuming bottlenecks. It is turned off by default and saves the results of the last 15 runs.
Check whether it is turned on (show variables like ‘profiling’;)
Turn on the function (set profiling = on;)
After turning it on, you can record the subsequent running of sql. Then use show profiles to view the results:
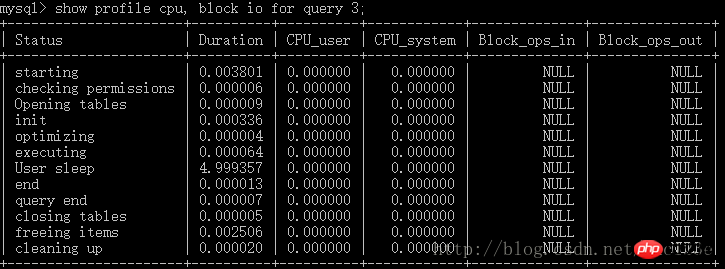
Further analyze the execution of a certain SQL statement through the command (show profile cpu, block io for query 3;), for example, the following analysis 3 No. SQL situation.
Some parameters behind Show profile:
All: Display all overhead information
-
Block io: Display block IO related overhead
Context switches: Context switch related overhead
Cpu: Display cpu related overhead
Memory: Display memory-related overhead
Source: Display overhead information related to source_function, source_file, source_line
Global query log
(Never turn it on in a production environment to view all executed SQL statements)
Set command:
set global general_log = 1;#以表的形式输出set global log_output = ‘TABLE’
After that, the SQL executed by mysql The statement will be recorded to the mysql.genearl_log table, which can be viewed with the following command:
select * from mysql.general_log;
It can also be configured in the configuration file and set as follows:
#开启General_log = 1#记录日志文件的路径General_log_file = D://path/logfile#输出格式Log_output=file
The above is the detailed content of Use MySQL to analyze SQL time-consuming issues. For more information, please follow other related articles on the PHP Chinese website!

Hot AI Tools

Undresser.AI Undress
AI-powered app for creating realistic nude photos

AI Clothes Remover
Online AI tool for removing clothes from photos.

Undress AI Tool
Undress images for free

Clothoff.io
AI clothes remover

Video Face Swap
Swap faces in any video effortlessly with our completely free AI face swap tool!

Hot Article
Hot Tools

Notepad++7.3.1
Easy-to-use and free code editor

SublimeText3 Chinese version
Chinese version, very easy to use

Zend Studio 13.0.1
Powerful PHP integrated development environment

Dreamweaver CS6
Visual web development tools

SublimeText3 Mac version
God-level code editing software (SublimeText3)
Hot Topics
 1386
1386
 52
52

 MySQL: Simple Concepts for Easy Learning
Apr 10, 2025 am 09:29 AM
MySQL: Simple Concepts for Easy Learning
Apr 10, 2025 am 09:29 AM
MySQL is an open source relational database management system. 1) Create database and tables: Use the CREATEDATABASE and CREATETABLE commands. 2) Basic operations: INSERT, UPDATE, DELETE and SELECT. 3) Advanced operations: JOIN, subquery and transaction processing. 4) Debugging skills: Check syntax, data type and permissions. 5) Optimization suggestions: Use indexes, avoid SELECT* and use transactions.
 How to open phpmyadmin
Apr 10, 2025 pm 10:51 PM
How to open phpmyadmin
Apr 10, 2025 pm 10:51 PM
You can open phpMyAdmin through the following steps: 1. Log in to the website control panel; 2. Find and click the phpMyAdmin icon; 3. Enter MySQL credentials; 4. Click "Login".
 MySQL: An Introduction to the World's Most Popular Database
Apr 12, 2025 am 12:18 AM
MySQL: An Introduction to the World's Most Popular Database
Apr 12, 2025 am 12:18 AM
MySQL is an open source relational database management system, mainly used to store and retrieve data quickly and reliably. Its working principle includes client requests, query resolution, execution of queries and return results. Examples of usage include creating tables, inserting and querying data, and advanced features such as JOIN operations. Common errors involve SQL syntax, data types, and permissions, and optimization suggestions include the use of indexes, optimized queries, and partitioning of tables.
 How to use single threaded redis
Apr 10, 2025 pm 07:12 PM
How to use single threaded redis
Apr 10, 2025 pm 07:12 PM
Redis uses a single threaded architecture to provide high performance, simplicity, and consistency. It utilizes I/O multiplexing, event loops, non-blocking I/O, and shared memory to improve concurrency, but with limitations of concurrency limitations, single point of failure, and unsuitable for write-intensive workloads.
 Why Use MySQL? Benefits and Advantages
Apr 12, 2025 am 12:17 AM
Why Use MySQL? Benefits and Advantages
Apr 12, 2025 am 12:17 AM
MySQL is chosen for its performance, reliability, ease of use, and community support. 1.MySQL provides efficient data storage and retrieval functions, supporting multiple data types and advanced query operations. 2. Adopt client-server architecture and multiple storage engines to support transaction and query optimization. 3. Easy to use, supports a variety of operating systems and programming languages. 4. Have strong community support and provide rich resources and solutions.
 MySQL's Place: Databases and Programming
Apr 13, 2025 am 12:18 AM
MySQL's Place: Databases and Programming
Apr 13, 2025 am 12:18 AM
MySQL's position in databases and programming is very important. It is an open source relational database management system that is widely used in various application scenarios. 1) MySQL provides efficient data storage, organization and retrieval functions, supporting Web, mobile and enterprise-level systems. 2) It uses a client-server architecture, supports multiple storage engines and index optimization. 3) Basic usages include creating tables and inserting data, and advanced usages involve multi-table JOINs and complex queries. 4) Frequently asked questions such as SQL syntax errors and performance issues can be debugged through the EXPLAIN command and slow query log. 5) Performance optimization methods include rational use of indexes, optimized query and use of caches. Best practices include using transactions and PreparedStatemen
 MySQL and SQL: Essential Skills for Developers
Apr 10, 2025 am 09:30 AM
MySQL and SQL: Essential Skills for Developers
Apr 10, 2025 am 09:30 AM
MySQL and SQL are essential skills for developers. 1.MySQL is an open source relational database management system, and SQL is the standard language used to manage and operate databases. 2.MySQL supports multiple storage engines through efficient data storage and retrieval functions, and SQL completes complex data operations through simple statements. 3. Examples of usage include basic queries and advanced queries, such as filtering and sorting by condition. 4. Common errors include syntax errors and performance issues, which can be optimized by checking SQL statements and using EXPLAIN commands. 5. Performance optimization techniques include using indexes, avoiding full table scanning, optimizing JOIN operations and improving code readability.
 Monitor Redis Droplet with Redis Exporter Service
Apr 10, 2025 pm 01:36 PM
Monitor Redis Droplet with Redis Exporter Service
Apr 10, 2025 pm 01:36 PM
Effective monitoring of Redis databases is critical to maintaining optimal performance, identifying potential bottlenecks, and ensuring overall system reliability. Redis Exporter Service is a powerful utility designed to monitor Redis databases using Prometheus. This tutorial will guide you through the complete setup and configuration of Redis Exporter Service, ensuring you seamlessly build monitoring solutions. By studying this tutorial, you will achieve fully operational monitoring settings
