

Foreword: The previous article explains in detail the core technology of constructing flow charts in js JsPlumb introduces the effect of JsPlumb on drawing flow charts in the browser, as well as a simple JsPlumb code example . In this article, let’s take a look at the code descriptions of each effect.
1. Code examples for setting the style and color effects of connections
The approximate effect is as shown in the figure:
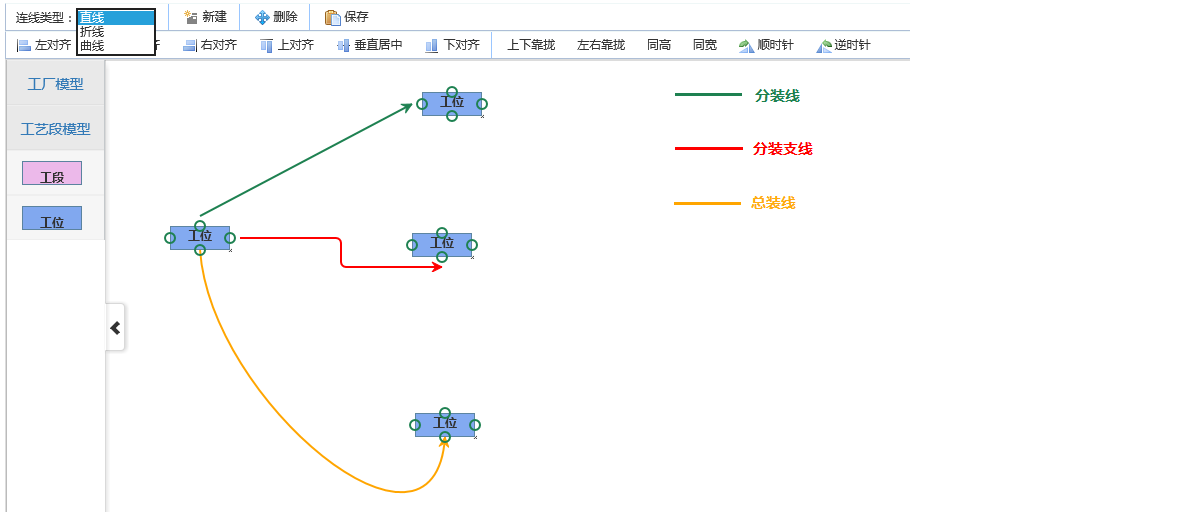
These effects look very simple, so how do we use code to achieve it. In the last chapter, we said that the connection style of JsPlumb is determined by certain attributes of the points. In this case, we can dynamically change the connection style by setting the point style. Let’s look at the code:
First let’s take a look at the connection type selection
1 2 3 4 5 6 7 8 |
|
Register the change event of select when the page is initialized
1 2 3 4 5 6 7 8 9 10 11 12 13 14 15 16 17 18 19 20 21 22 23 24 25 26 27 28 29 30 31 32 33 34 35 36 37 38 39 40 41 42 43 44 45 46 47 48 49 50 51 52 53 54 55 56 57 58 59 60 61 62 63 64 65 |
|
In fact, it only takes a few lines of code to set the connection style of the endpoints that already exist and will be dragged to the interface.
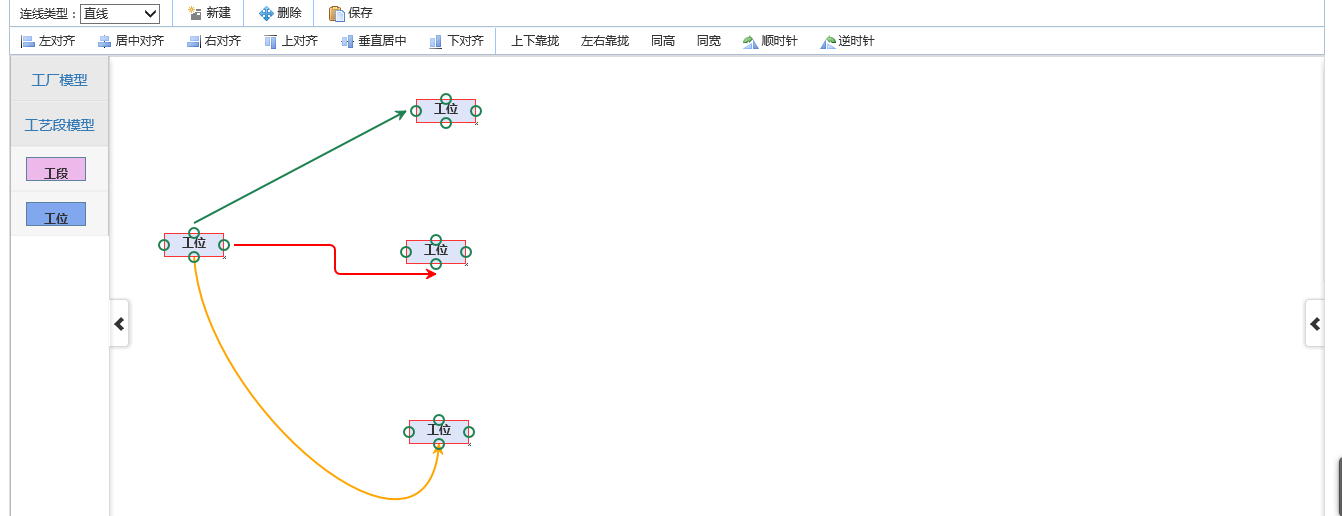
2. Select all, select all drag effect code examples
You can select elements and drag elements and connections in batches. The approximate effect is:
Look at the implementation code:
1. Registration can be selected during initialization
1 2 3 4 5 6 7 8 |
|
2. Select relevant methods
1 2 3 4 5 6 7 8 9 10 11 12 13 14 15 16 17 18 19 20 21 22 23 24 25 26 27 28 29 30 31 32 33 34 35 36 37 38 39 40 41 42 43 44 45 46 47 48 49 50 51 52 53 54 55 56 57 58 59 60 61 62 63 64 65 66 67 68 69 70 71 72 73 74 75 76 77 78 79 80 81 82 83 84 85 86 87 88 89 90 91 92 93 94 95 96 97 98 99 100 101 102 103 104 105 106 107 108 109 110 111 112 113 114 115 116 117 118 119 120 121 122 123 124 125 126 127 128 129 130 131 132 133 134 135 136 137 138 139 140 141 142 143 144 145 146 147 148 149 150 151 152 153 154 155 156 157 158 159 160 161 162 163 164 165 166 167 168 169 170 171 172 173 174 175 176 177 178 179 180 181 182 183 184 185 186 187 188 189 190 191 192 193 194 195 196 197 198 199 200 201 202 203 204 205 206 207 208 209 210 211 212 213 214 215 216 217 218 219 220 221 222 223 224 225 226 227 228 229 230 231 232 233 234 235 236 237 238 239 240 241 242 243 244 245 246 247 248 249 250 251 252 253 254 255 256 257 258 |
|
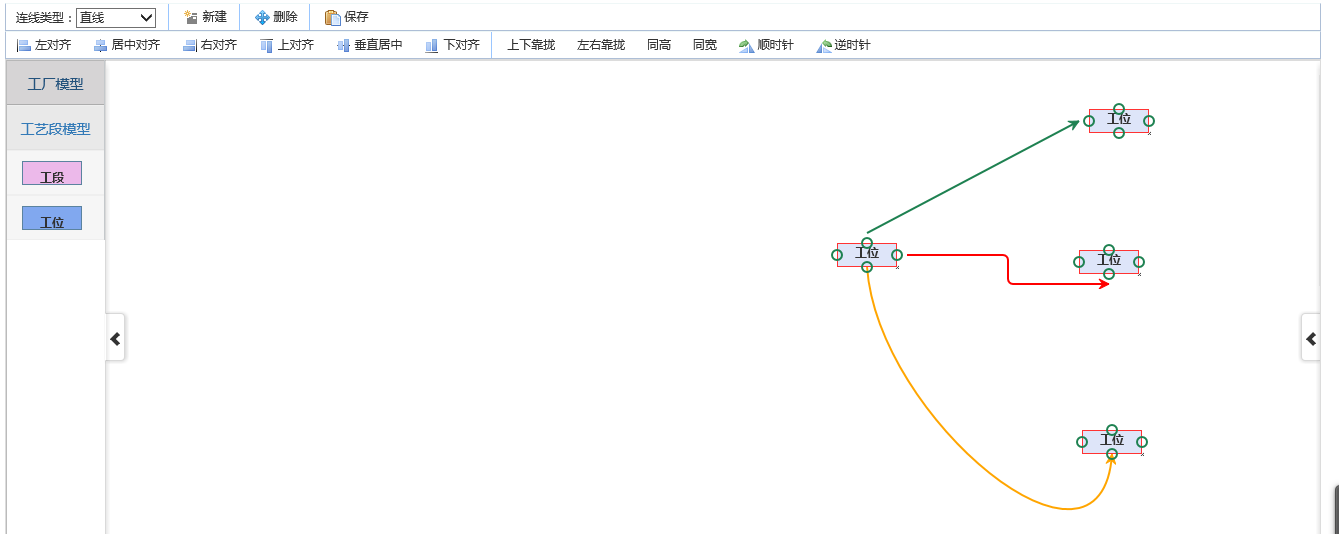
3. Alignment and rotation code examples
1 2 3 4 5 6 7 8 9 10 11 12 13 14 15 16 17 18 19 20 21 22 23 24 25 26 27 28 29 30 31 32 33 34 35 36 37 38 39 40 41 42 43 44 45 46 47 48 49 50 51 52 53 54 55 56 57 58 59 60 61 62 63 64 65 66 67 68 69 70 71 72 73 74 75 76 77 78 79 80 81 82 83 84 85 86 87 88 89 90 91 92 93 94 95 96 97 98 99 100 101 102 103 104 105 106 107 108 109 110 111 112 113 114 115 116 117 118 119 120 121 122 123 124 125 126 127 128 129 130 131 132 133 134 135 136 137 138 139 140 141 142 143 144 145 146 147 148 149 150 151 152 153 154 155 156 157 158 159 160 161 162 163 164 165 166 167 168 169 170 171 172 173 174 175 176 177 178 179 180 181 182 183 184 185 186 187 188 189 190 191 192 193 194 195 196 197 198 199 200 201 202 203 204 205 206 207 208 209 210 211 212 213 214 215 216 217 218 219 220 221 222 223 224 225 226 227 228 229 230 231 232 233 234 235 236 237 238 239 240 241 242 |
|
The code may be a bit messy and needs to be sorted out. In the previous chapter, a blogger asked me for the source code. This time I have released a preliminary version. I hope it can help everyone better learn the core technology of flow charts, JsPlumb.


![[Web front-end] Node.js quick start](https://img.php.cn/upload/course/000/000/067/662b5d34ba7c0227.png)


