How to use mysql to complete data generation in excel
Excel is the most commonly used tool in data analysis. This article compares the functions of mysql and excel to introduce how to use mysql to complete data generation, data cleaning, preprocessing, and the most common data classification and data filtering in excel. Classification, aggregation, and data pivot operations. In this article, we introduce parts 5, 6, and 7, data extraction, data screening, and data summary and perspective. This article mainly introduces relevant information on how to use mysql to complete data generation in excel. Friends in need can refer to it.
 5. Data extraction
The fifth part is data extraction, which is also the most common task in data analysis. The following describes how to use each function.
Extract data by columns
#Extract data by columns SELECT city FROM data1;

Extract data by rows
#按行提取
SELECT * FROM data1 WHERE city='beijing';

Extract data by location
#按位置提取
SELECT * FROM data1 LIMIT 2,5;

Extract data by conditions
#按条件提取并计算 SELECT AVG(price) FROM data1 WHERE city='beijing' AND age<25;

6, data filtering
The sixth part is data filtering. Use the three conditions of AND, OR, NOT and greater than, less than and equal to filter the data, and perform counting and summing. Similar to the filtering function and countifs and sumifs functions in excel.
Filter by conditions (AND, OR, NOT)
The Excel data directory provides a "Filter" function, which is used to filter data tables according to different conditions. WHERE is used in mysql to complete the filtering operation. With the sum and count functions, it can also realize the functions of sumif and countif functions in excel.
#数据筛选AND
SELECT * FROM data1 WHERE city='shanghai' AND age>30;

##
#数据筛选IN
SELECT * FROM data1 WHERE city IN ('shanghai','beijing');

#数据筛选OR
SELECT * FROM data1 WHERE city='shanghai' OR age>30;

#数据筛选(不等于)
SELECT * FROM data1 WHERE city !='beijing';

##
#数据筛选like(模糊筛选)
SELECT * FROM data1 WHERE city LIKE 'bei%';
##
#筛选后计数 countif
SELECT COUNT(id) AS id_count FROM data1 WHERE city='shanghai'AND age>30;

#筛选后求和 sumtif SELECT SUM(price) AS price FROM data1 WHERE city='beijing' AND age<30;

#筛选后求均值 averageif
SELECT AVG(price) AS avg_price FROM data1 WHERE city !='beijing';

##7, Data classification, summary and perspective
 Classification and Summary
Excel's data directory provides the "Classification and Summary" function, which can summarize the data table according to the specified fields and summary methods. The corresponding operations are completed through GROUP BY in mysql, and multi-level classification and aggregation can be supported.
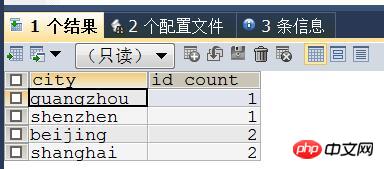
GROUP BY is a function for classification and aggregation. The method of use is very simple. Just specify the column name to be grouped. You can also specify multiple column names at the same time. GROUP BY press Column names are grouped in the order in which they appear. At the same time, it is necessary to formulate a summary method after grouping. The two common ones are counting and summing.#单列分类汇总 SELECT city,COUNT(id) AS id_count FROM data1 GROUP BY city ORDER BY id_count;
##
#多列分类汇总
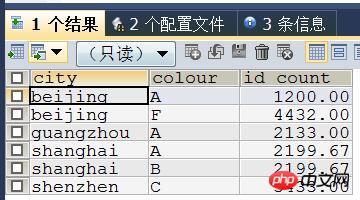
SELECT city,colour,ROUND(SUM(price),2) AS id_count FROM data1 GROUP BY city,colour;
The "PivotTable" function is provided under the insert directory in Excel to summarize the data table according to specific dimensions. Pivot table functionality is not directly provided in mysql. But the same effect is achieved through the CASE WHEN function.
数据透视表也是常用的一种数据分类汇总方式,并且功能上比GROUP BY要强大一些。下面的代码中设定city为行字段,colour为列字段,price为值字段,计算price金额。
#查看原始数据表
SELECT * FROM data1;

#使用CASE WHEN进行数据透视
CREATE VIEW data_Items AS (
 SELECT
 data1.city,
 CASE WHEN colour = "A" THEN price END AS A,
 CASE WHEN colour = "B" THEN price END AS B,
 CASE WHEN colour = "C" THEN price END AS C,
 CASE WHEN colour = "F" THEN price END AS F
 FROM data1
);
#查看结果
SELECT * FROM data_Items;

#对字段进行求和汇总
CREATE VIEW data1_Extended_Pivot AS (
 SELECT
 city,
 SUM(A) AS A,
 SUM(B) AS B,
 SUM(C) AS C,
 SUM(F) AS F
 FROM data_Items
 GROUP BY city
);
#查看结果
SELECT * FROM data1_Extended_Pivot;

#对空值进行处理
CREATE VIEW data1_Extended_Pivot_Pretty AS (
 SELECT
 city,
 COALESCE(A, 0) AS A,
 COALESCE(B, 0) AS B,
 COALESCE(C, 0) AS C,
 COALESCE(F, 0) AS F
 FROM data1_Extended_Pivot
);
#查看数据透视结果
SELECT * FROM data1_Extended_Pivot_Pretty;

大家在开发过程中可能会经常遇到,现在就跟着本文尝试操作一下吧。
相关推荐:
The above is the detailed content of How to use mysql to complete data generation in excel. For more information, please follow other related articles on the PHP Chinese website!

Hot AI Tools

Undresser.AI Undress
AI-powered app for creating realistic nude photos

AI Clothes Remover
Online AI tool for removing clothes from photos.

Undress AI Tool
Undress images for free

Clothoff.io
AI clothes remover

Video Face Swap
Swap faces in any video effortlessly with our completely free AI face swap tool!

Hot Article

Hot Tools

Notepad++7.3.1
Easy-to-use and free code editor

SublimeText3 Chinese version
Chinese version, very easy to use

Zend Studio 13.0.1
Powerful PHP integrated development environment

Dreamweaver CS6
Visual web development tools

SublimeText3 Mac version
God-level code editing software (SublimeText3)

Hot Topics
 1386
1386
 52
52
 MySQL: Simple Concepts for Easy Learning
Apr 10, 2025 am 09:29 AM
MySQL is an open source relational database management system. 1) Create database and tables: Use the CREATEDATABASE and CREATETABLE commands. 2) Basic operations: INSERT, UPDATE, DELETE and SELECT. 3) Advanced operations: JOIN, subquery and transaction processing. 4) Debugging skills: Check syntax, data type and permissions. 5) Optimization suggestions: Use indexes, avoid SELECT* and use transactions.
 How to open phpmyadmin
Apr 10, 2025 pm 10:51 PM
You can open phpMyAdmin through the following steps: 1. Log in to the website control panel; 2. Find and click the phpMyAdmin icon; 3. Enter MySQL credentials; 4. Click "Login".
 MySQL: An Introduction to the World's Most Popular Database
Apr 12, 2025 am 12:18 AM
MySQL is an open source relational database management system, mainly used to store and retrieve data quickly and reliably. Its working principle includes client requests, query resolution, execution of queries and return results. Examples of usage include creating tables, inserting and querying data, and advanced features such as JOIN operations. Common errors involve SQL syntax, data types, and permissions, and optimization suggestions include the use of indexes, optimized queries, and partitioning of tables.
 How to use single threaded redis
Apr 10, 2025 pm 07:12 PM
Redis uses a single threaded architecture to provide high performance, simplicity, and consistency. It utilizes I/O multiplexing, event loops, non-blocking I/O, and shared memory to improve concurrency, but with limitations of concurrency limitations, single point of failure, and unsuitable for write-intensive workloads.
 Why Use MySQL? Benefits and Advantages
Apr 12, 2025 am 12:17 AM
MySQL is chosen for its performance, reliability, ease of use, and community support. 1.MySQL provides efficient data storage and retrieval functions, supporting multiple data types and advanced query operations. 2. Adopt client-server architecture and multiple storage engines to support transaction and query optimization. 3. Easy to use, supports a variety of operating systems and programming languages. 4. Have strong community support and provide rich resources and solutions.
 MySQL and SQL: Essential Skills for Developers
Apr 10, 2025 am 09:30 AM
MySQL and SQL are essential skills for developers. 1.MySQL is an open source relational database management system, and SQL is the standard language used to manage and operate databases. 2.MySQL supports multiple storage engines through efficient data storage and retrieval functions, and SQL completes complex data operations through simple statements. 3. Examples of usage include basic queries and advanced queries, such as filtering and sorting by condition. 4. Common errors include syntax errors and performance issues, which can be optimized by checking SQL statements and using EXPLAIN commands. 5. Performance optimization techniques include using indexes, avoiding full table scanning, optimizing JOIN operations and improving code readability.
 MySQL's Place: Databases and Programming
Apr 13, 2025 am 12:18 AM
MySQL's position in databases and programming is very important. It is an open source relational database management system that is widely used in various application scenarios. 1) MySQL provides efficient data storage, organization and retrieval functions, supporting Web, mobile and enterprise-level systems. 2) It uses a client-server architecture, supports multiple storage engines and index optimization. 3) Basic usages include creating tables and inserting data, and advanced usages involve multi-table JOINs and complex queries. 4) Frequently asked questions such as SQL syntax errors and performance issues can be debugged through the EXPLAIN command and slow query log. 5) Performance optimization methods include rational use of indexes, optimized query and use of caches. Best practices include using transactions and PreparedStatemen
 Monitor Redis Droplet with Redis Exporter Service
Apr 10, 2025 pm 01:36 PM
Effective monitoring of Redis databases is critical to maintaining optimal performance, identifying potential bottlenecks, and ensuring overall system reliability. Redis Exporter Service is a powerful utility designed to monitor Redis databases using Prometheus. This tutorial will guide you through the complete setup and configuration of Redis Exporter Service, ensuring you seamlessly build monitoring solutions. By studying this tutorial, you will achieve fully operational monitoring settings


