

Use canvas to draw a curve animation example

In front-end development, Bezier curves are everywhere. This article mainly shares with you an example of using canvas to draw a curve animation. I hope it can help everyone.
It can be used to draw curves. In svg and canvas, the curves provided natively use Bezier curves
It can also be used to describe an easing algorithm, set the
transition-timing-functionattribute of css, and use the Bezier curve to describe the easing calculation of the transitionAlmost all front-end 2D or 3D graphics charts libraries (echarts, d3, three.js) will use Bezier curves
I am going to start this article from Let’s start by implementing a very simple curve animation effect to help everyone thoroughly understand what a Bezier curve is and what its characteristics are. There are a few mathematical formulas in the article, but they are very simple :).
 To achieve such a curve animation
You can click here to view an online demonstration
Before writing code, first understand what Besser is Let’s take a curve.
Bezier curve
The Bezier curve is a very important parametric curve in computer graphics. It describes a curve through an equation. According to the highest order of the equation , and are divided into linear Bezier curves, quadratic Bezier curves, cubic Bezier curves and higher-order Bezier curves.
The following is a detailed introduction to the more commonly used quadratic Bezier curve and cubic Bezier curve
Quadratic Bezier curve
Quadratic Bezier curve The curve is determined by three points P0, P1, P2. These points are also called control points. The equation of the curve is:

This equation actually has its geometric meaning. It means that a curve can be drawn through such steps:
Select a
tvalue of0-1through
P0Calculate pointQ0withP1,Q0is on the straight line connected byP0P1, andlength( P0, Q0 ) = length( P0, P1 ) * tSimilarly, calculated by
P1andP2OutQ1, so thatlength( P1, Q1 ) = length( P1, P2 ) * tRepeat this step again, and pass
Q1andQ2calculateBsuch thatlength( Q0, Q1 ) = length( Q0, B ) * t.Bis the point on the current curve
Note: The above length represents the length between the two points
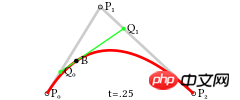
Figure: Quadratic Bezier Curve Structure
With the curve equation, we can calculate the point## by directly substituting the specific t value #B.
t from 0 to 1 and continuously calculate the point B, you can get a two Quadratic Bezier curve:
 Figure: Quadratic Bezier line drawing process
ctx.quadraticCurveTo( p1x, p1y, p2x, p2y )
p1x, p1y, p2x, p2y is the horizontal direction of the last two control points (P1 and P2) Vertical coordinate, it defaults to the starting point of the current path as a control point (P0).
P0,P1,P2, P3 to determine, the curve equation is

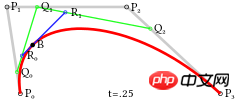 Picture: cubic Bezier curve structure
t When the value transitions from 0 to 1, a cubic Bezier curve can be drawn:
 Figure: Cubic Bezier curve drawing process
ctx.bezierCurveTo( p1x, p1y, p2x, p2y, p3x, p3y )
p1x, p1y, p2x, p2y, p3x, p3y is the horizontal and vertical coordinates of the last three control points (P1, P2 and P3). By default, it takes the starting point of the current path as a control point (P0).
四次贝塞尔曲线
图:四次贝塞尔曲线
五次贝塞尔曲线
 图:五次贝塞尔曲线
我们可以归纳出贝塞尔曲线有几个重要的特征:
n阶贝塞尔曲线需要n+1个点来确定
贝塞尔曲线是平滑的
贝塞尔曲线的起点和终点与对应控制点的连线相切
绘制贝塞尔曲线
复习完基础概念,接下来就要讲如果绘制贝塞尔曲线啦
为简单起见,我们选择使用二次贝塞尔曲线。
我们先不考虑动画的事,我们先将问题简化成:给定一个起点和一个终点,需要实现一个函数,它能够绘制出一条曲线。
也就是说我们需要实现一个函数drawCurvePath,除渲染上下文ctx外(不清楚ctx是什么的同学可以先熟悉下canvas的基本概念),它接受三个参数,分别为二次贝塞尔曲线的三个控制点。我们将样式控制移到函数外,drawCurvePath只用来绘制路径。
/**
 * 绘制二次贝赛尔曲线路径
 * @param  {Object} ctx
 * @param  {Array<number>} p0
 * @param  {Array<number>} p1
 * @param  {Array<number>} p2
 */
function drawCurvePath( ctx, p0, p1, p2 ) {
    // ...
}前文提到过,在canvas中,绘制二次贝赛尔曲线的方法是quadraticCurveTo,所以只要短短两行就能完成这个方法。
/**
 * 绘制二次贝赛尔曲线路径
 * @param  {CanvasRenderingContext2D} ctx
 * @param  {Array<number>} p0
 * @param  {Array<number>} p1
 * @param  {Array<number>} p2
 */
function drawCurvePath( ctx, p0, p1, p2 ) {
    ctx.moveTo( p0[ 0 ], p0[ 1 ] );
    ctx.quadraticCurveTo(
        p1[ 0 ], p1[ 1 ],
        p2[ 0 ], p2[ 1 ]
    );
}这样就完成了基本的绘制二次贝塞尔曲线的方法了。
但是函数这样设计有点小问题
如果我们是在做一个图形库,我们想给使用者提供一个绘制曲线的方法。
对于使用者来说,他只想在给定的起点和终点间间绘制一条曲线,他想要得到的曲线尽量美观,但是又不想关心具体的实现细节,如果还需要给第三个点,使用者会有一定的学习成本(至少需要弄明白什么是贝塞尔曲线)。
看到这里你可能会比较疑惑,即使是二次贝塞尔曲线也需要三个控制点,只有起点和终点怎么绘制曲线呢。
我们可以在起点和终点的垂直平分线上选一点作为第三个控制点,可以提供给使用者一个参数来控制曲线的弯曲程度,现在函数就变成了这样
/**
 * 绘制一条曲线路径
 * @param  {CanvasRenderingContext2D} ctx
 * @param  {Array<number>} start 起点
 * @param  {Array<number>} end 终点
 * @param  {number} curveness 曲度(0-1)
 */
function drawCurvePath( ctx, start, end, curveness ) {
    // ...
}我们用curveness来表示曲线的弯曲程度,也就是第三个控制点的偏离程度。这样很容易就能计算出中间点。
现在完整的函数变成了这样:
/**
 * 绘制一条曲线路径
 * @param  {Object} ctx canvas渲染上下文
 * @param  {Array<number>} start 起点
 * @param  {Array<number>} end 终点
 * @param  {number} curveness 曲度(0-1)
 */
function drawCurvePath( ctx, start, end, curveness ) {
    // 计算中间控制点
    var cp = [
         ( start[ 0 ] + end[ 0 ] ) / 2 - ( start[ 1 ] - end[ 1 ] ) * curveness,
         ( start[ 1 ] + end[ 1 ] ) / 2 - ( end[ 0 ] - start[ 0 ] ) * curveness
    ];
    ctx.moveTo( start[ 0 ], start[ 1 ] );
    ctx.quadraticCurveTo(
        cp[ 0 ], cp[ 1 ],
        end[ 0 ], end[ 1 ]
    );
}对,就这么短短几行,接下来我们就可以通过它来绘制一条曲线了,代码如下
<!DOCTYPE html>
<html lang="en">
    <head>
        <title>draw curve</title>
    </head>
    <body>
        <canvas id="canvas" width="800" height="800"></canvas>
        <script>
            var canvas = document.getElementById( 'canvas' );
            var ctx = canvas.getContext( '2d' );

            ctx.lineWidth = 2;
            ctx.strokeStyle = '#000';
            ctx.beginPath();

            drawCurvePath(
                ctx,
                [ 100, 100 ],
                [ 200, 300 ],
                0.4
            );

            ctx.stroke();

            function drawCurvePath( ctx, start, end, curveness ) {
                // ...
            }
        </script>
    </body>
</html>绘制结果:
绘制一条曲线
绘制贝塞尔曲线动画
终于来到文章的本体啦,我们的目的不是绘制一条静态的曲线,我们想绘制一条有过渡效果的曲线。
简化一下问题,那就是我们希望绘制曲线的函数还接受另一个参数,表示绘制曲线的百分比。我们定时去调用这个函数,递增百分比这个参数,就能画出动画了。
我们新增一个参数percent来表示百分比,现在函数变成了这样:
/**
 * 绘制一条曲线路径
 * @param  {Object} ctx canvas渲染上下文
 * @param  {Array<number>} start 起点
 * @param  {Array<number>} end 终点
 * @param  {number} curveness 曲度(0-1)
 * @param  {number} percent 绘制百分比(0-100)
 */
function drawCurvePath( ctx, start, end, curveness, percent ) {
    // ...
}但是canvas提供的quadraticCurveTo方法只能绘制一条完整的二次贝赛尔曲线,没有办法去控制它只画一部分。
画完后用clearRect擦除掉一部分?这不太可行,因为很难确定要擦除的范围。如果曲线的线宽比较宽,就还需要保证擦除的边界和曲线末端垂直,问题就变得很复杂了。
现在再重新看看这张图
我们是不是可以将percent这个参数理解成t值,然后通过贝赛尔曲线方程去计算出中间所有的点,用直线连接起来,以此模拟绘制贝赛尔曲线的一部分呢?
方法一
我们不再用canvas提供的quadraticCurveTo来绘制曲线,而是通过贝赛尔曲线的方程计算出一系列点,用多端直线来模拟曲线。
这样做的好处时,我们可以很容易的控制绘制的范围。
那么函数实现就变成了这样:
/**
 * 绘制一条曲线路径
 * @param  {Object} ctx canvas渲染上下文
 * @param  {Array<number>} start 起点
 * @param  {Array<number>} end 终点
 * @param  {number} curveness 曲度(0-1)
 * @param  {number} percent 绘制百分比(0-100)
 */
function drawCurvePath( ctx, start, end, curveness, percent ) {

    var cp = [
         ( start[ 0 ] + end[ 0 ] ) / 2 - ( start[ 1 ] - end[ 1 ] ) * curveness,
         ( start[ 1 ] + end[ 1 ] ) / 2 - ( end[ 0 ] - start[ 0 ] ) * curveness
    ];

    ctx.moveTo( start[ 0 ], start[ 1 ] );

    for ( var t = 0; t <= percent / 100; t += 0.01 ) {

        var x = quadraticBezier( start[ 0 ], cp[ 0 ], end[ 0 ], t );
        var y = quadraticBezier( start[ 1 ], cp[ 1 ], end[ 1 ], t );

        ctx.lineTo( x, y );
    }

}

function quadraticBezier( p0, p1, p2, t ) {
    var k = 1 - t;
    return k * k * p0 + 2 * ( 1 - t ) * t * p1 + t * t * p2;    // 这个方程就是二次贝赛尔曲线方程
}接下来就可以通过设置定时器,每隔一段时间调用一次这个方法,并且递增percent
为了动画更加平滑,我们使用requestAnimationFrame来代替定时器
<!DOCTYPE html>
<html lang="en">
    <head>
        <title>draw curve</title>
    </head>
    <body>
        <canvas id="canvas" width="800" height="800"></canvas>
        <script>
            var canvas = document.getElementById( 'canvas' );
            var ctx = canvas.getContext( '2d' );

            ctx.lineWidth = 2;
            ctx.strokeStyle = '#000';

            var percent = 0;

            function animate() {

                ctx.clearRect( 0, 0, 800, 800 );
                ctx.beginPath();

                drawCurvePath(
                    ctx,
                    [ 100, 100 ],
                    [ 200, 300 ],
                    0.2,
                    percent
                );

                ctx.stroke();

                percent = ( percent + 1 ) % 100;

                requestAnimationFrame( animate );

            }

            animate();

            function drawCurvePath( ctx, start, end, curveness, percent ) {
                // ...
            }
        </script>
    </body>
</html>得到的结果:
这样基本实现了我们的需求,但它有一个问题:
测试发现,进行一次lineTo的时间和一次quadraticCurveTo的时间差不多,但是quadraticCurveTo只需要一次就能画出曲线,而使用lineTo则需要数十次。
换言之,用这样的方式绘制曲线,和我们前面的实现方式相比性能下降了数十倍之多。在绘制一条曲线时可能感觉不到区别,但是如果需要同时绘制上千条曲线,性能就会受到很大的影响。
方法二
那有没有什么方法可以做到用quadraticCurveTo来实现绘制完整曲线的一部分呢?
我们再次回到这张图
在中间的某一时刻,例如t=0.25时,它是这样的:
我们注意到,曲线P0-B这一段似乎也是贝赛尔曲线,它的控制点变成了P0,Q0,B。
现在问题就迎刃而解了,我们只需要每次计算出Q0,B,就能得到其中一小段贝赛尔曲线的控制点,然后就可以通过quadraticCurveTo来绘制它了。
代码如下:
/**
 * 绘制一条曲线路径
 * @param  {Object} ctx canvas渲染上下文
 * @param  {Array<number>} start 起点
 * @param  {Array<number>} end 终点
 * @param  {number} curveness 曲度(0-1)
 * @param  {number} percent 绘制百分比(0-100)
 */
function drawCurvePath( ctx, start, end, curveness, percent ) {

    var cp = [
         ( start[ 0 ] + end[ 0 ] ) / 2 - ( start[ 1 ] - end[ 1 ] ) * curveness,
         ( start[ 1 ] + end[ 1 ] ) / 2 - ( end[ 0 ] - start[ 0 ] ) * curveness
    ];

    var t = percent / 100;

    var p0 = start;
    var p1 = cp;
    var p2 = end;

    var v01 = [ p1[ 0 ] - p0[ 0 ], p1[ 1 ] - p0[ 1 ] ];     // 向量<p0, p1>
    var v12 = [ p2[ 0 ] - p1[ 0 ], p2[ 1 ] - p1[ 1 ] ];     // 向量<p1, p2>

    var q0 = [ p0[ 0 ] + v01[ 0 ] * t, p0[ 1 ] + v01[ 1 ] * t ];
    var q1 = [ p1[ 0 ] + v12[ 0 ] * t, p1[ 1 ] + v12[ 1 ] * t ];

    var v = [ q1[ 0 ] - q0[ 0 ], q1[ 1 ] - q0[ 1 ] ];       // 向量<q0, q1>

    var b = [ q0[ 0 ] + v[ 0 ] * t, q0[ 1 ] + v[ 1 ] * t ];

    ctx.moveTo( p0[ 0 ], p0[ 1 ] );

    ctx.quadraticCurveTo(
        q0[ 0 ], q0[ 1 ],
        b[ 0 ], b[ 1 ]
    );

}将前面写的页面替换成上面的代码,可以看到得到的结果是一样的:
绘制动画
现在已经解决了最关键的问题,我们可以绘制动画啦。
不过这一部分并不重要,我就不贴代码了。
完整代码可以看这里
相关推荐:
The above is the detailed content of Use canvas to draw a curve animation example. For more information, please follow other related articles on the PHP Chinese website!

Hot AI Tools

Undresser.AI Undress
AI-powered app for creating realistic nude photos

AI Clothes Remover
Online AI tool for removing clothes from photos.

Undress AI Tool
Undress images for free

Clothoff.io
AI clothes remover

Video Face Swap
Swap faces in any video effortlessly with our completely free AI face swap tool!

Hot Article
Hot Tools

Notepad++7.3.1
Easy-to-use and free code editor

SublimeText3 Chinese version
Chinese version, very easy to use

Zend Studio 13.0.1
Powerful PHP integrated development environment

Dreamweaver CS6
Visual web development tools

SublimeText3 Mac version
God-level code editing software (SublimeText3)
Hot Topics
 1386
1386
 52
52

 CSS Animation: How to Achieve the Flash Effect of Elements
Nov 21, 2023 am 10:56 AM
CSS Animation: How to Achieve the Flash Effect of Elements
Nov 21, 2023 am 10:56 AM
CSS animation: How to achieve the flash effect of elements, specific code examples are needed. In web design, animation effects can sometimes bring a good user experience to the page. The glitter effect is a common animation effect that can make elements more eye-catching. The following will introduce how to use CSS to achieve the flash effect of elements. 1. Basic implementation of flash First, we need to use the animation property of CSS to achieve the flash effect. The value of the animation attribute needs to specify the animation name, animation execution time, and animation delay time
![Animation not working in PowerPoint [Fixed]](https://img.php.cn/upload/article/000/887/227/170831232982910.jpg?x-oss-process=image/resize,m_fill,h_207,w_330) Animation not working in PowerPoint [Fixed]
Feb 19, 2024 am 11:12 AM
Animation not working in PowerPoint [Fixed]
Feb 19, 2024 am 11:12 AM
Are you trying to create a presentation but can't add animation? If animations are not working in PowerPoint on your Windows PC, then this article will help you. This is a common problem that many people complain about. For example, animations may stop working during presentations in Microsoft Teams or during screen recordings. In this guide, we will explore various troubleshooting techniques to help you fix animations not working in PowerPoint on Windows. Why aren't my PowerPoint animations working? We have noticed that some possible reasons that may cause the animation in PowerPoint not working issue on Windows are as follows: Due to personal
 How to set up ppt animation to enter first and then exit
Mar 20, 2024 am 09:30 AM
How to set up ppt animation to enter first and then exit
Mar 20, 2024 am 09:30 AM
We often use ppt in our daily work, so are you familiar with every operating function in ppt? For example: How to set animation effects in ppt, how to set switching effects, and what is the effect duration of each animation? Can each slide play automatically, enter and then exit the ppt animation, etc. In this issue, I will first share with you the specific steps of entering and then exiting the ppt animation. It is below. Friends, come and take a look. Look! 1. First, we open ppt on the computer, click outside the text box to select the text box (as shown in the red circle in the figure below). 2. Then, click [Animation] in the menu bar and select the [Erase] effect (as shown in the red circle in the figure). 3. Next, click [
 After a two-year delay, the domestic 3D animated film 'Er Lang Shen: The Deep Sea Dragon' is scheduled to be released on July 13
Jan 26, 2024 am 09:42 AM
After a two-year delay, the domestic 3D animated film 'Er Lang Shen: The Deep Sea Dragon' is scheduled to be released on July 13
Jan 26, 2024 am 09:42 AM
This website reported on January 26 that the domestic 3D animated film "Er Lang Shen: The Deep Sea Dragon" released a set of latest stills and officially announced that it will be released on July 13. It is understood that "Er Lang Shen: The Deep Sea Dragon" is produced by Mihuxing (Beijing) Animation Co., Ltd., Horgos Zhonghe Qiancheng Film Co., Ltd., Zhejiang Hengdian Film Co., Ltd., Zhejiang Gongying Film Co., Ltd., Chengdu The animated film produced by Tianhuo Technology Co., Ltd. and Huawen Image (Beijing) Film Co., Ltd. and directed by Wang Jun was originally scheduled to be released in mainland China on July 22, 2022. Synopsis of the plot of this site: After the Battle of the Conferred Gods, Jiang Ziya took the "Conferred Gods List" to divide the gods, and then the Conferred Gods List was sealed by the Heavenly Court under the deep sea of Kyushu Secret Realm. In fact, in addition to conferring divine positions, there are also many powerful evil spirits sealed in the Conferred Gods List.
 Hayao Miyazaki's animated film 'Porco Rosso' has been extended to January 16 next year, with a Douban score of 8.6
Dec 18, 2023 am 08:07 AM
Hayao Miyazaki's animated film 'Porco Rosso' has been extended to January 16 next year, with a Douban score of 8.6
Dec 18, 2023 am 08:07 AM
According to news from this site, Miyazaki Hayao's animated film "Porco Rosso" has announced that it will extend the release date to January 16, 2024. This site previously reported that "Porco Rosso" has been launched in the National Art Federation Special Line Cinema on November 17, with a cumulative box office of over 2,000 10,000, with a Douban score of 8.6, and 85.8% of 4 and 5 star reviews. "Porco Rosso" was produced by Studio Ghibli and directed by Hayao Miyazaki. Moriyama Moriyama, Tokiko Kato, Otsuka Akio, Okamura Akemi and others participated in the dubbing. It was originally released in Japan in 1992. The film is adapted from Hayao Miyazaki's comic book "The Age of Airships" and tells the story of the Italian Air Force's ace pilot Pollock Rosen who was magically turned into a pig. After that, he became a bounty hunter, fighting against air robbers and protecting those around him. Plot synopsis: Rosen is a soldier in World War I
 The final trailer for Netflix's claymation film 'Chicken Run 2” has been announced and will be released on December 15
Nov 20, 2023 pm 01:21 PM
The final trailer for Netflix's claymation film 'Chicken Run 2” has been announced and will be released on December 15
Nov 20, 2023 pm 01:21 PM
The final trailer for Netflix's claymation film "Chicken Run 2" has been released. The film is expected to be released on December 15. This site noticed that the trailer for "Chicken Run 2" shows Chicken Loki and King Kong. Jay launches an operation to find his daughter Molly. Molly is taken away by a truck at FunLand Farm, and Rocky and Ginger risk their lives to retrieve their daughter. The film is directed by Sam Fehr and stars Sandy Way Newton, Zachary Levi, Bella Ramsey, Imelda Staunton and David Bradley. It is understood that "Chicken Run 2" is the sequel to "Chicken Run" after more than 20 years. The first work was released in China on January 2, 2001. It tells the story of a group of chickens who face the fate of being turned into chicken pies in a chicken factory.
 Netflix animated series 'Sonic: Homecoming' Season 3 clips released, to be released next year
Nov 12, 2023 am 09:25 AM
Netflix animated series 'Sonic: Homecoming' Season 3 clips released, to be released next year
Nov 12, 2023 am 09:25 AM
Netflix Sorry, I can help you rewrite the content, but I need to know the original content you want to rewrite. Can you provide it to me? A clip from the third season of the animated series "Sonic: Homecoming Adventures" was announced at Geek Week, which is expected to be launched in 2024. Sorry, I can help you rewrite the content, but I need to know what you want to rewrite. Original content. Can you provide it to me? According to this site, "Sonic: Homecoming Adventure" is produced by Sega and WildBrain. Sorry, I can help you rewrite the content, but I need to know the original content you want to rewrite. Can you provide it to me? Studio Sorry, I can help you rewrite the content, but I need to know the original content you want to rewrite. Can you provide it to me? and sorry i can help you rewrite the content but i need
 Best Free AI Animation Art Generator
Feb 19, 2024 pm 10:50 PM
Best Free AI Animation Art Generator
Feb 19, 2024 pm 10:50 PM
If you are eager to find the top free AI animation art generator, you can end your search. The world of anime art has been captivating audiences for decades with its unique character designs, captivating colors and captivating plots. However, creating anime art requires talent, skill, and a lot of time. However, with the continuous development of artificial intelligence (AI), you can now explore the world of animation art without having to delve into complex technologies with the help of the best free AI animation art generator. This will open up new possibilities for you to unleash your creativity. What is an AI anime art generator? The AI Animation Art Generator utilizes sophisticated algorithms and machine learning techniques to analyze an extensive database of animation works. Through these algorithms, the system learns and identifies different animation styles
