Node Inspector agent implementation example tutorial
This article mainly introduces the Node Inspector proxy implementation. The editor thinks it is quite good. Now I will share it with you and give it as a reference. Let’s follow the editor to take a look, I hope it can help everyone.
Background
When doing node development, breakpoint debugging through node inspector is a very common debugging method. However, there are several problems that will reduce our debugging efficiency.
Question 1: When using vscode for breakpoint debugging, if the application starts the inspector through the cluster, then every time the worker hangs and restarts, the inspector's port will increase automatically. Although the inspectPort fixed debugging port can be specified in the node8.x version, it is not supported in node6.x. This will cause the debugging port to be respecified in vscode every time the worker is restarted.
Question 2: When using devtools for debugging, you need to copy the devtools link to chrome for debugging every time. The port change problem mentioned above will cause the devtools link to change. In addition, every time Restarting the inspector will also cause the devtools link to change because the websocket id has changed.
Simplifying the above two problems is:
Debug in vscode, and you can reconnect after the inspector port is changed or the websocket id is changed.
Debug in devtools and you can reconnect after the inspector port is changed or the websocket id is changed.
Solution
There is currently a solution in the industry which is the chrome plug-in Node Inspector Manager (Nim), but this can only solve the problem of application restart under the same inspector port. The problem of post-link changes cannot solve the problem of self-increment of ports caused by cluster startup, unless multiple ports are specified in Nim in advance. Furthermore, Nim is a plug-in on chrome and cannot do anything for debugging in vscode.
So the best solution is naturally to use node as the inspector agent. The solution is as follows:
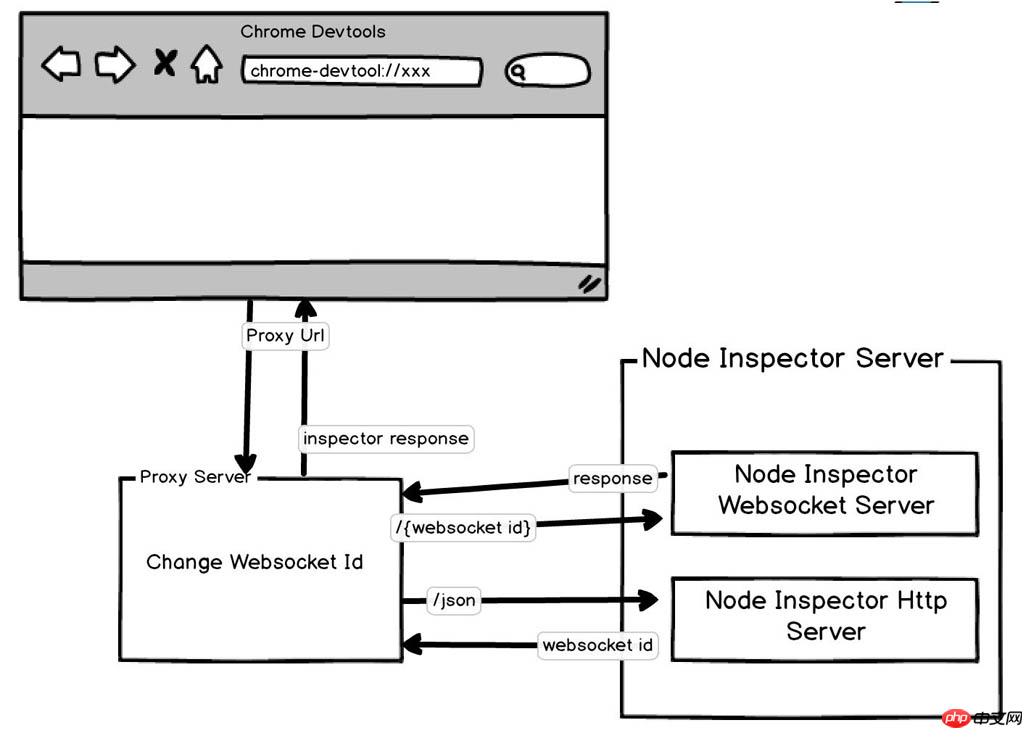
For the first problem, on vscode, it will call the /json interface by itself Get the latest websocket id, and then use the new websocket id to connect to the node inspector service. Therefore, the solution is to implement a tcp proxy function for data forwarding.
For the second question, since devtools will not automatically obtain the new websocket id, we need to do dynamic replacement, so the solution is to use the proxy service to get the websocket id from /json, and then shake hands with the websocket When the websocket id is dynamically replaced in the request header.
Drawed a flow chart:
Implementation steps
1. Tcp proxy
First, implement The function of a tcp proxy is actually very simple. It is to create a Tcp Server for the proxy port through the node's net module, and then when there is a connection, create a connection to the target port, and then the data can be forwarded. .
The simple implementation is as follows:
const net = require('net');
const proxyPort = 9229;
const forwardPort = 5858;

net.createServer(client => {
 const server = net.connect({
  host: '127.0.0.1',
  port: forwardPort,
 }, () => {
  client.pipe(server).pipe(client);
 });
 // 如果真要应用到业务中,还得监听一下错误/关闭事件,在连接关闭时即时销毁创建的 socket。
}).listen(proxyPort);The above implements a relatively simple proxy service, which connects the data of the two services through the pipe method. When the client has data, it will be forwarded to the server, and when the server has data, it will also be forwarded to the client.
After completing this Tcp proxy function, the debugging requirements of vscode can be realized. Specify the port as the proxy port in launch.json under the project in vscode, and add the configuration in configurations
{
 "type": "node",
 "request": "attach",
 "name": "Attach",
 "protocol": "inspector",
 "restart": true,
 "port": 9229
}Then when the application is restarted or the inspect port is changed, vscode can automatically reattach to your application through the proxy port.
2. Obtain websocketId
This step begins to solve the problem of being able to reattach when the devtools link remains unchanged. When starting the node inspector server, the inspector service also provides A /json http interface is used to obtain the websocket id.
This is quite simple. Just send an http request to /json of the target port and you can get the data:
[ { description: 'node.js instance',
  devtoolsFrontendUrl: '...',
  faviconUrl: 'https://nodejs.org/static/favicon.ico',
  id: 'e7ef6313-1ce0-4b07-b690-d3cf5274d8b0',
  title: '/Users/wanghx/Workspace/larva-team/vscode-log/index.js',
  type: 'node',
  url: 'file:///Users/wanghx/Workspace/larva-team/vscode-log/index.js',
webSocketDebuggerUrl: 'ws://127.0.0.1:5858/e7ef6313-1ce0-4b07-b690-d3cf5274d8b0' } ]The id field in the above data is the websocket we need id.
3. Inspector proxy
After getting the websocket id, you can dynamically replace the websocket id in the tcp proxy. First we need a fixed link, so first set a proxy link, such as My proxy service port is 9229, then the proxy link of chrome devtools is:
chrome-devtools://devtools/bundled/inspector.html?experiments=true&v8only=true&ws=127.0.0.1:9229/__ws_proxy__
Except for the last ws=127.0.0.1:9229/__ws_proxy__, the others are fixed, and the last one can be seen at a glance as a websocket link. Among them, __ws_proxy__ is used as a placeholder. When chrome devtools initiates a websocket handshake request to this proxy link, it replaces __ws_proxy__ with the websocket id and then forwards it to the node's inspector service.
Just make some minor modifications to the pipe logic code in the above tcp proxy.
const through = require('through2');
...

client
   .pipe(through.obj((chunk, enc, done) => {
    if (chunk[0] === 0x47 && chunk[1] === 0x45 && chunk[2] === 0x54) {
     const content = chunk.toString();
     if (content.includes('__ws_proxy__')) {
      return done(null, Buffer.from(content.replace('__ws_proxy__', websocketId)));
     }
    }
    done(null, chunk);
   }))
   .pipe(server)
   .pipe(client);
...Create a transform stream through through2 to make changes to the transmitted data.
简单判断一下 chunk 的头三个字节是否为GET,如果是 GET 说明这可能是个 http 请求,也就可能是 websocket 的协议升级请求。把请求头打印出来就是这个样子的:
GET /__ws_proxy__ HTTP/1.1
Host: 127.0.0.1:9229
Connection: Upgrade
Pragma: no-cache
Cache-Control: no-cache
Upgrade: websocket
Origin: chrome-devtools://devtools
Sec-WebSocket-Version: 13
...
然后将其中的路径/__ws_proxy替换成对应的 websocketId,然后转发到 node 的 inspector server 上,即可完成 websocket 的握手,接下来的 websocket 通信就不需要对数据做处理,直接转发即可。
接下来就算各种重启应用,或者更换 inspector 的端口,都不需要更换 debug 链接,只需要再 inspector server 重启的时候,在下图的弹窗中

点击一下 Reconnect DevTools 即可恢复 debug。
相关推荐:
Web Inspector:关于在 Sublime Text 中调试Js的介绍_基础知识
The above is the detailed content of Node Inspector agent implementation example tutorial. For more information, please follow other related articles on the PHP Chinese website!

Hot AI Tools

Undresser.AI Undress
AI-powered app for creating realistic nude photos

AI Clothes Remover
Online AI tool for removing clothes from photos.

Undress AI Tool
Undress images for free

Clothoff.io
AI clothes remover

Video Face Swap
Swap faces in any video effortlessly with our completely free AI face swap tool!

Hot Article

Hot Tools

Notepad++7.3.1
Easy-to-use and free code editor

SublimeText3 Chinese version
Chinese version, very easy to use

Zend Studio 13.0.1
Powerful PHP integrated development environment

Dreamweaver CS6
Visual web development tools

SublimeText3 Mac version
God-level code editing software (SublimeText3)

Hot Topics
 SVM examples in Python
Jun 11, 2023 pm 08:42 PM
Support Vector Machine (SVM) in Python is a powerful supervised learning algorithm that can be used to solve classification and regression problems. SVM performs well when dealing with high-dimensional data and non-linear problems, and is widely used in data mining, image classification, text classification, bioinformatics and other fields. In this article, we will introduce an example of using SVM for classification in Python. We will use the SVM model from the scikit-learn library
 How to use express to handle file upload in node project
Mar 28, 2023 pm 07:28 PM
How to handle file upload? The following article will introduce to you how to use express to handle file uploads in the node project. I hope it will be helpful to you!
 An in-depth analysis of Node's process management tool 'pm2”
Apr 03, 2023 pm 06:02 PM
This article will share with you Node's process management tool "pm2", and talk about why pm2 is needed, how to install and use pm2, I hope it will be helpful to everyone!
 Pi Node Teaching: What is a Pi Node? How to install and set up Pi Node?
Mar 05, 2025 pm 05:57 PM
Detailed explanation and installation guide for PiNetwork nodes This article will introduce the PiNetwork ecosystem in detail - Pi nodes, a key role in the PiNetwork ecosystem, and provide complete steps for installation and configuration. After the launch of the PiNetwork blockchain test network, Pi nodes have become an important part of many pioneers actively participating in the testing, preparing for the upcoming main network release. If you don’t know PiNetwork yet, please refer to what is Picoin? What is the price for listing? Pi usage, mining and security analysis. What is PiNetwork? The PiNetwork project started in 2019 and owns its exclusive cryptocurrency Pi Coin. The project aims to create a one that everyone can participate
 Token-based authentication with Angular and Node
Sep 01, 2023 pm 02:01 PM
Authentication is one of the most important parts of any web application. This tutorial discusses token-based authentication systems and how they differ from traditional login systems. By the end of this tutorial, you will see a fully working demo written in Angular and Node.js. Traditional Authentication Systems Before moving on to token-based authentication systems, let’s take a look at traditional authentication systems. The user provides their username and password in the login form and clicks Login. After making the request, authenticate the user on the backend by querying the database. If the request is valid, a session is created using the user information obtained from the database, and the session information is returned in the response header so that the session ID is stored in the browser. Provides access to applications subject to
 What is a single sign-on system? How to implement it using nodejs?
Feb 24, 2023 pm 07:33 PM
What is a single sign-on system? How to implement it using nodejs? The following article will introduce to you how to use node to implement a single sign-on system. I hope it will be helpful to you!
 VUE3 Getting Started Example: Making a Simple Video Player
Jun 15, 2023 pm 09:42 PM
As the new generation of front-end frameworks continues to emerge, VUE3 is loved as a fast, flexible, and easy-to-use front-end framework. Next, let's learn the basics of VUE3 and make a simple video player. 1. Install VUE3 First, we need to install VUE3 locally. Open the command line tool and execute the following command: npminstallvue@next Then, create a new HTML file and introduce VUE3: <!doctypehtml>
 Learn best practice examples of pointer conversion in Golang
Feb 24, 2024 pm 03:51 PM
Golang is a powerful and efficient programming language that can be used to develop various applications and services. In Golang, pointers are a very important concept, which can help us operate data more flexibly and efficiently. Pointer conversion refers to the process of pointer operations between different types. This article will use specific examples to learn the best practices of pointer conversion in Golang. 1. Basic concepts In Golang, each variable has an address, and the address is the location of the variable in memory.


