
 Web Front-end
HTML Tutorial
Detailed explanation of how canvas uses Bezier curves to smoothly fit polyline segments
Web Front-end
HTML Tutorial
Detailed explanation of how canvas uses Bezier curves to smoothly fit polyline segments
Detailed explanation of how canvas uses Bezier curves to smoothly fit polyline segments

This article mainly introduces the relevant information on the method of smoothly fitting polyline segments using Bezier curve based on canvas. The editor thinks it is quite good, so I will share it with you now and give it as a reference. Let’s follow the editor to take a look, I hope it can help everyone.
Write at the front
This time I will share how to "smooth" the edges and corners of the drawn polyline segments in canvas, that is, through the Bezier curve Each plotted point replaces the original line chart.
Why we need to smoothly fit polyline segments
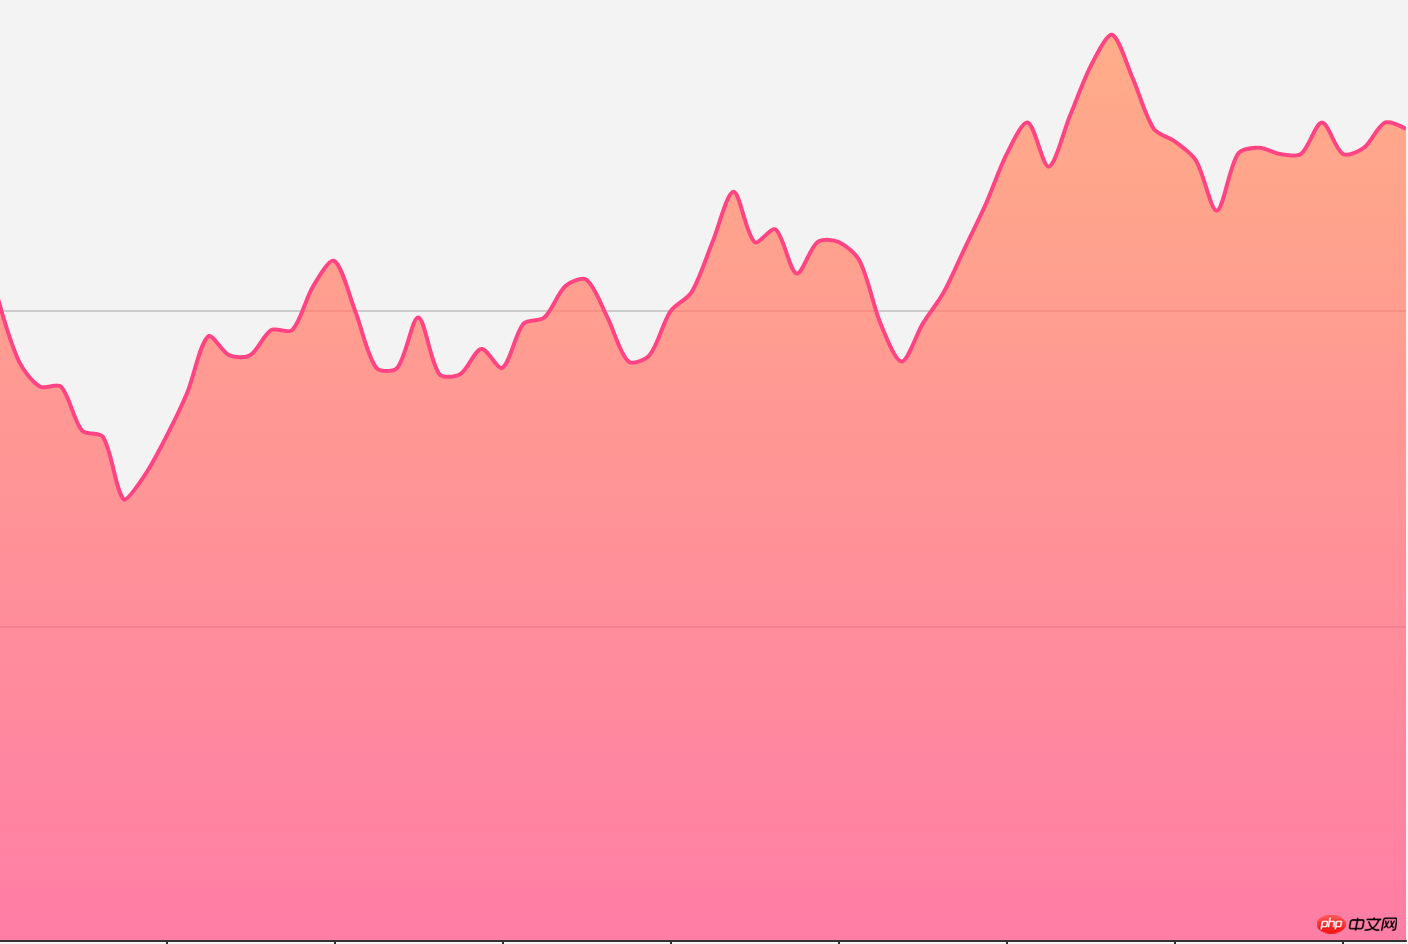
Let’s first look at the rendering effect of the line chart under Echarts:
At first I didn’t notice that this polyline segment was actually passed through by a curve. I just thought it was a simple point drawing, so the “simple (ugly) easy (ugly)” version I implemented at first was like this:
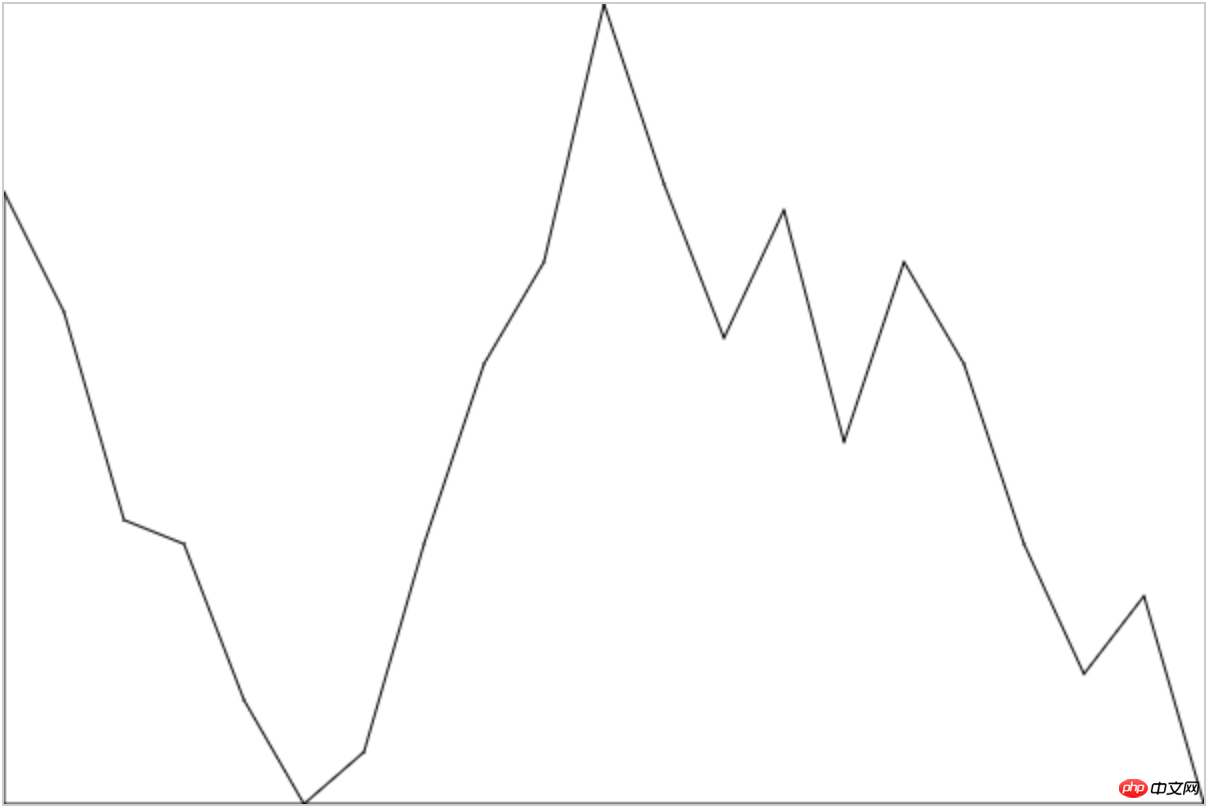
Don’t pay attention to the style. The point is that after implementation, I discovered that the implementation of Echarts seems to be very smooth, which also triggered subsequent discussions. How to draw smooth curves regularly?
Rendering
Let’s take a look at the final imitation implementation:
Because I don’t know how Echarts is implemented internally (escape
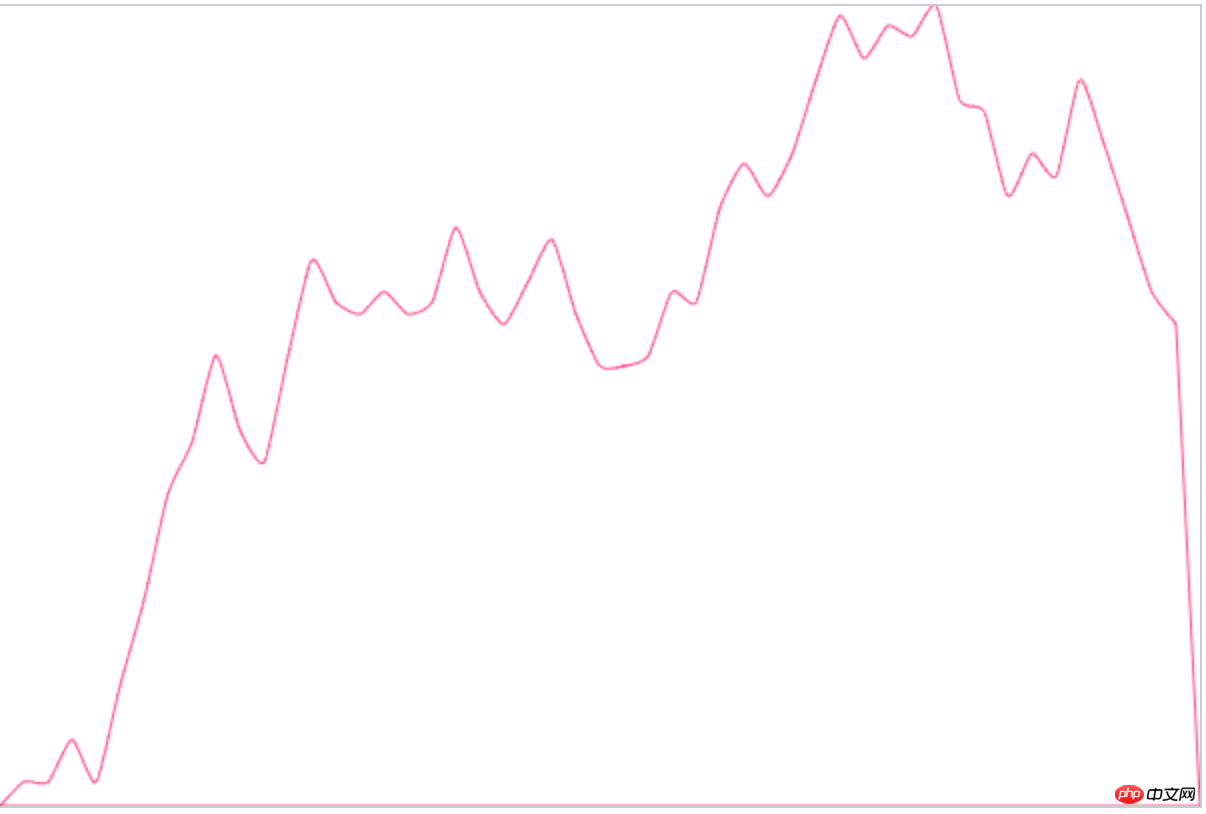
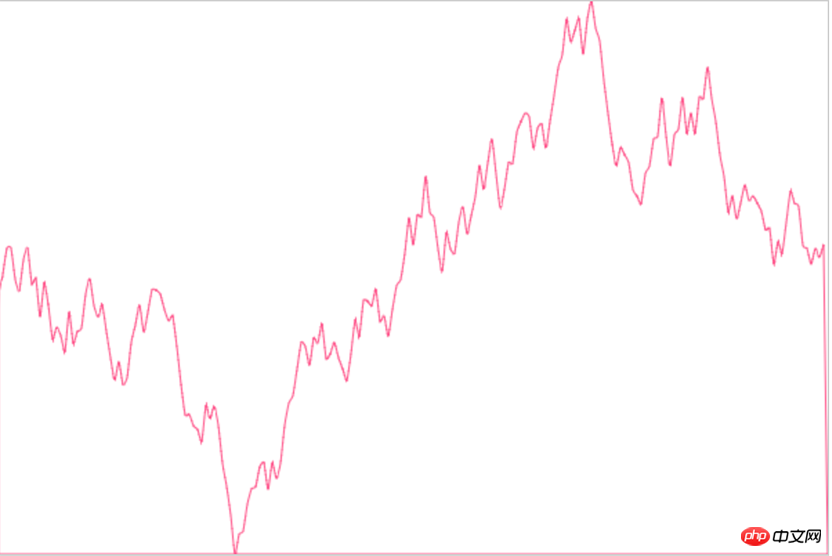
It looks very round, very close to our original idea. Let’s see if the curve passes through the drawing point:
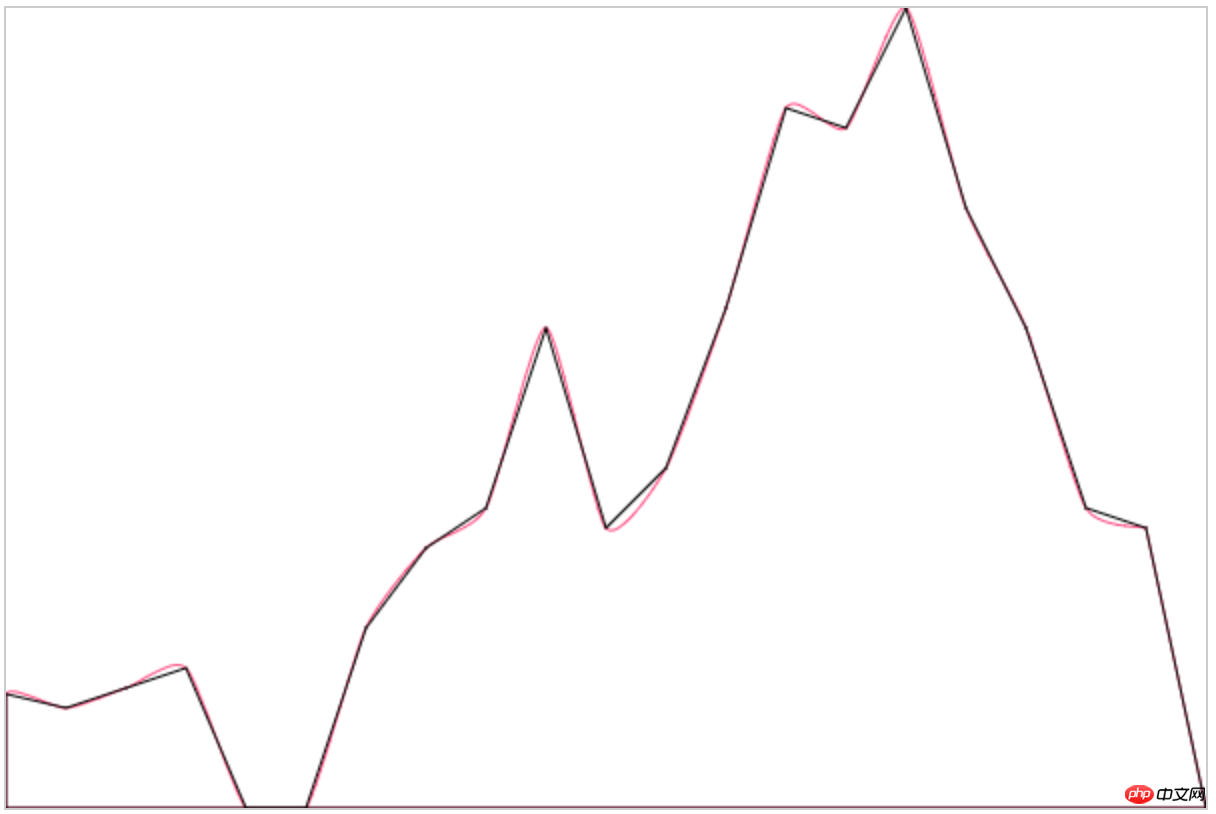
Okay! The result is obvious. Now let’s take a look at our implementation process
- Drawing a line chart
- Bezier curve smooth fitting
- Simulated data
var data = [Math.random() * 300];
for (var i = 1; i < 50; i++) { //按照echarts
data.push(Math.round((Math.random() - 0.5) * 20 + data[i - 1]));
}
option = {
canvas:{
id: 'canvas'
},
series: {
name: '模拟数据',
itemStyle: {
color: 'rgb(255, 70, 131)'
},
areaStyle: {
color: 'rgb(255, 158, 68)'
},
data: data
}
};Drawing a line chart
function LinearGradient(option) {
    this.canvas = document.getElementById(option.canvas.id)
    this.ctx = this.canvas.getContext('2d')
    this.width = this.canvas.width
    this.height = this.canvas.height
    this.tooltip = option.tooltip
    this.title = option.text
    this.series = option.series //存放模拟数据
} Draw a line chart:
LinearGradient.prototype.draw1 = function() { //折线参考线
    ...
    //要考虑到canvas中的原点是左上角,
    //所以下面要做一些换算,
    //diff为x,y轴被数据最大值和最小值的取值范围所平分的等份。
    this.series.data.forEach(function(item, index) {
        var x = diffX * index,
            y = Math.floor(self.height - diffY * (item - dataMin))
        self.ctx.lineTo(x, y) //绘制各个数据点
    })
    ...
}
Bezier curve smooth fitting
The key point of Bezier curve is the selection of control points. This website can dynamically display different curves drawn with different control points. As for the calculation of control points... the author still chose Baidu because he is not good at mathematics:). Students who are interested in the specific algorithm can learn more about it. Now let’s talk about the conclusion of calculating control points.
The above formula involves four coordinate points, the current point, the previous point and the next two points, and when the coordinate values are shown in the figure below, it is drawn The curve is as follows: 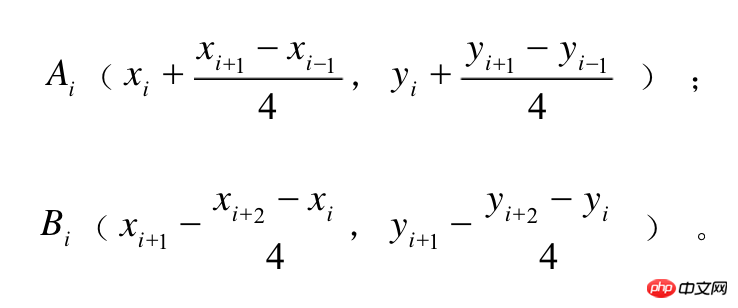
#However, there is a problem that this formula cannot be used for the starting point and the last point, but that article also gives a method for handling boundary values. :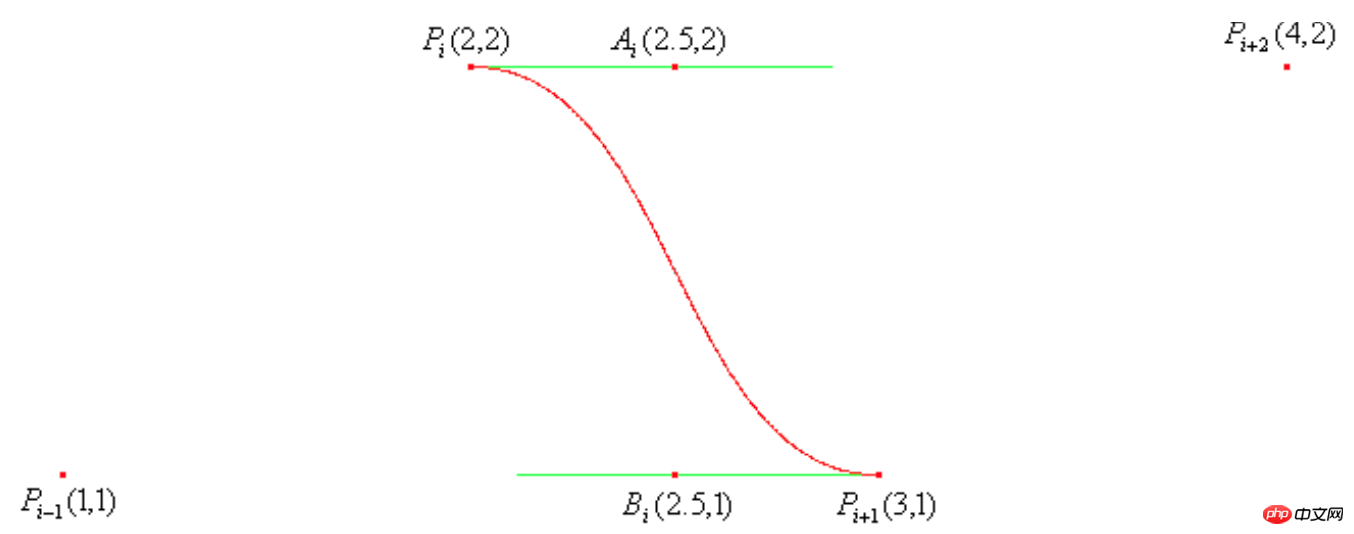
So when changing the polyline to a smooth curve, calculate the boundary values and other control points and then substitute them into the Bessel function: 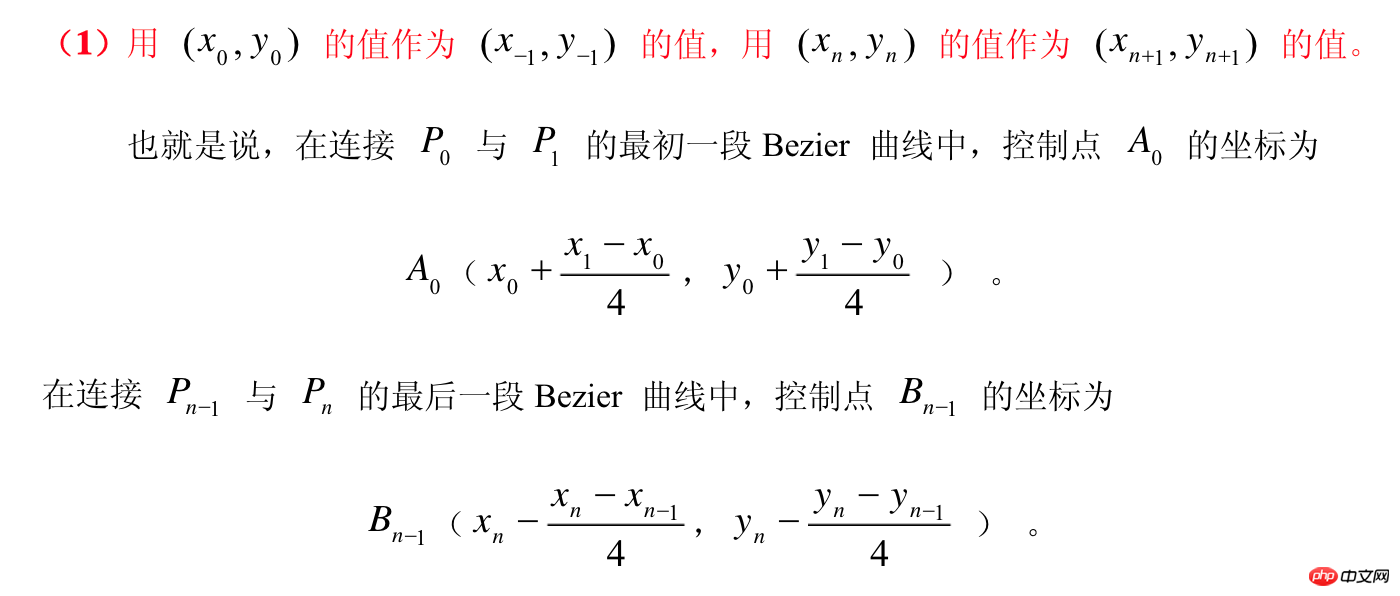
//核心实现
this.series.data.forEach(function(item, index) { //找到前一个点到下一个点中间的控制点
    var scale = 0.1 //分别对于ab控制点的一个正数,可以分别自行调整
    var last1X = diffX * (index - 1),
        last1Y = Math.floor(self.height - diffY * (self.series.data[index - 1] - dataMin)),
        //前一个点坐标
        last2X = diffX * (index - 2),
        last2Y = Math.floor(self.height - diffY * (self.series.data[index - 2] - dataMin)),
        //前两个点坐标
        nowX = diffX * (index),
        nowY = Math.floor(self.height - diffY * (self.series.data[index] - dataMin)),
        //当期点坐标
        nextX = diffX * (index + 1),
        nextY = Math.floor(self.height - diffY * (self.series.data[index + 1] - dataMin)),
        //下一个点坐标
        cAx = last1X + (nowX - last2X) * scale,
        cAy = last1Y + (nowY - last2Y) * scale,
        cBx = nowX - (nextX - last1X) * scale,
        cBy = nowY - (nextY - last1Y) * scale
    if(index === 0) {
        self.ctx.lineTo(nowX, nowY)
        return
    } else if(index ===1) {
        cAx = last1X + (nowX - 0) * scale
        cAy = last1Y + (nowY - self.height) * scale
    } else if(index === self.series.data.length - 1) {
        cBx = nowX - (nowX - last1X) * scale
        cBy = nowY - (nowY - last1Y) * scale
    }
        self.ctx.bezierCurveTo(cAx, cAy, cBx, cBy, nowX, nowY);
        //绘制出上一个点到当前点的贝塞尔曲线
})Since the point I traverse each time is the current point, but the formula given in the article is a control point algorithm that calculates the next point, so in the code implementation I moved all the point calculations forward one position. When index = 0, which is the initial point, no curve is required to be drawn, because we are drawing a curve from the previous point to the current point, and there is no curve to 0 that needs to be drawn. Starting from index = 1, we can start drawing normally. The curve from 0 to 1, because there is no second point in front of it when index = 1, it is a boundary value point, which requires special calculation, and finally one point. The rest can be calculated according to the normal formula and the xy coordinates of AB are substituted into the Bessel function.
Canvas implements high-order Bezier curve
Detailed explanation of the application of Bezier curve
The above is the detailed content of Detailed explanation of how canvas uses Bezier curves to smoothly fit polyline segments. For more information, please follow other related articles on the PHP Chinese website!

Hot AI Tools

Undresser.AI Undress
AI-powered app for creating realistic nude photos

AI Clothes Remover
Online AI tool for removing clothes from photos.

Undress AI Tool
Undress images for free

Clothoff.io
AI clothes remover

AI Hentai Generator
Generate AI Hentai for free.

Hot Article
Hot Tools

Notepad++7.3.1
Easy-to-use and free code editor

SublimeText3 Chinese version
Chinese version, very easy to use

Zend Studio 13.0.1
Powerful PHP integrated development environment

Dreamweaver CS6
Visual web development tools

SublimeText3 Mac version
God-level code editing software (SublimeText3)
Hot Topics
 1386
1386
 52
52

 Which schools use canvas?
Aug 18, 2023 pm 05:59 PM
Which schools use canvas?
Aug 18, 2023 pm 05:59 PM
Schools using canvas include Stanford University, MIT, Columbia University, University of California, Berkeley, etc. Detailed introduction: 1. Stanford University uses Canvas as its main online learning platform. Teachers and students at Stanford University use Canvas to manage and communicate course content, and learn through functions such as online discussions, assignment submissions, and exams; 2. Ma Provincial Polytechnic Institute and MIT also use Canvas as their online learning management system and conduct course management through the Canvas platform; 3. Columbia University, etc.
 What are the canvas arrow plug-ins?
Aug 21, 2023 pm 02:14 PM
What are the canvas arrow plug-ins?
Aug 21, 2023 pm 02:14 PM
The canvas arrow plug-ins include: 1. Fabric.js, which has a simple and easy-to-use API and can create custom arrow effects; 2. Konva.js, which provides the function of drawing arrows and can create various arrow styles; 3. Pixi.js , which provides rich graphics processing functions and can achieve various arrow effects; 4. Two.js, which can easily create and control arrow styles and animations; 5. Arrow.js, which can create various arrow effects; 6. Rough .js, you can create hand-drawn arrows, etc.
 What are the details of the canvas clock?
Aug 21, 2023 pm 05:07 PM
What are the details of the canvas clock?
Aug 21, 2023 pm 05:07 PM
The details of the canvas clock include clock appearance, tick marks, digital clock, hour, minute and second hands, center point, animation effects, other styles, etc. Detailed introduction: 1. Clock appearance, you can use Canvas to draw a circular dial as the appearance of the clock, and you can set the size, color, border and other styles of the dial; 2. Scale lines, draw scale lines on the dial to represent hours or minutes. Position; 3. Digital clock, you can draw a digital clock on the dial to indicate the current hour and minute; 4. Hour hand, minute hand, second hand, etc.
 What versions of html2canvas are there?
Aug 22, 2023 pm 05:58 PM
What versions of html2canvas are there?
Aug 22, 2023 pm 05:58 PM
The versions of html2canvas include html2canvas v0.x, html2canvas v1.x, etc. Detailed introduction: 1. html2canvas v0.x, which is an early version of html2canvas. The latest stable version is v0.5.0-alpha1. It is a mature version that has been widely used and verified in many projects; 2. html2canvas v1.x, this is a new version of html2canvas.
 Learn the canvas framework and explain the commonly used canvas framework in detail
Jan 17, 2024 am 11:03 AM
Learn the canvas framework and explain the commonly used canvas framework in detail
Jan 17, 2024 am 11:03 AM
Explore the Canvas framework: To understand what are the commonly used Canvas frameworks, specific code examples are required. Introduction: Canvas is a drawing API provided in HTML5, through which we can achieve rich graphics and animation effects. In order to improve the efficiency and convenience of drawing, many developers have developed different Canvas frameworks. This article will introduce some commonly used Canvas frameworks and provide specific code examples to help readers gain a deeper understanding of how to use these frameworks. 1. EaselJS framework Ea
 uniapp implements how to use canvas to draw charts and animation effects
Oct 18, 2023 am 10:42 AM
uniapp implements how to use canvas to draw charts and animation effects
Oct 18, 2023 am 10:42 AM
How to use canvas to draw charts and animation effects in uniapp requires specific code examples 1. Introduction With the popularity of mobile devices, more and more applications need to display various charts and animation effects on the mobile terminal. As a cross-platform development framework based on Vue.js, uniapp provides the ability to use canvas to draw charts and animation effects. This article will introduce how uniapp uses canvas to achieve chart and animation effects, and give specific code examples. 2. canvas
 What properties does tkinter canvas have?
Aug 21, 2023 pm 05:46 PM
What properties does tkinter canvas have?
Aug 21, 2023 pm 05:46 PM
The tkinter canvas attributes include bg, bd, relief, width, height, cursor, highlightbackground, highlightcolor, highlightthickness, insertbackground, insertwidth, selectbackground, selectforeground, xscrollcommand attributes, etc. Detailed introduction
 Explore the powerful role and application of canvas in game development
Jan 17, 2024 am 11:00 AM
Explore the powerful role and application of canvas in game development
Jan 17, 2024 am 11:00 AM
Understand the power and application of canvas in game development Overview: With the rapid development of Internet technology, web games are becoming more and more popular among players. As an important part of web game development, canvas technology has gradually emerged in game development, showing its powerful power and application. This article will introduce the potential of canvas in game development and demonstrate its application through specific code examples. 1. Introduction to canvas technology Canvas is a new element in HTML5, which allows us to use
