

HighCharts drawing 2D donut chart effect example sharing

This article mainly introduces the effect of jQuery plug-in HighCharts to draw a 2D donut chart, and analyzes the implementation steps and related operating techniques of jQuery using the HighCharts plug-in to draw a donut chart in the form of examples. It also comes with demo source code for readers to download and refer to. Friends in need You can refer to it, I hope it can help everyone.
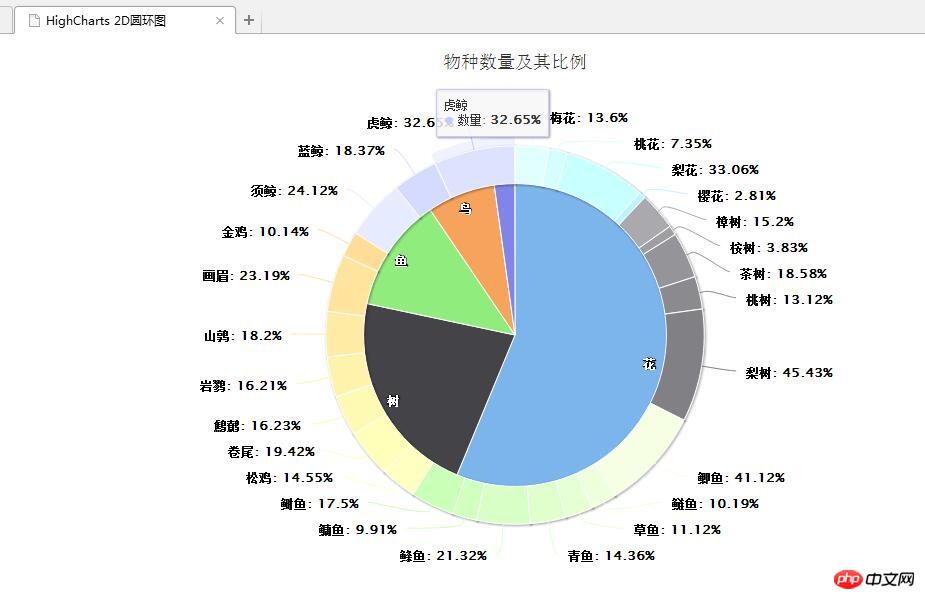
The example in this article describes the effect of drawing a 2D donut chart with the jQuery plug-in HighCharts. Share it with everyone for your reference, the details are as follows:
1. Example code:
<!DOCTYPE html>
<html>
<head>
<meta charset="UTF-8">
<title>HighCharts 2D圆环图</title>
<script type="text/javascript" src="js/jquery-1.7.2.min.js"></script>
<script type="text/javascript" src="js/highcharts.js"></script>
<script type="text/javascript">
$(function(){
var colors = Highcharts.getOptions().colors,
categories = ['花', '树', '鱼', '鸟', '鲸'],
name = 'Browser brands',
data = [{
y: 55.11,
color: colors[0],
drilldown: {
name: '花的种类',
categories: ['梅花', '桃花', '梨花', '樱花'],
data: [13.6, 7.35, 33.06, 2.81],
color: colors[0]
}
}, {
y: 21.63,
color: colors[1],
drilldown: {
name: '树的种类',
categories: ['樟树', '桉树', '茶树', '桃树', '梨树'],
data: [15.20, 3.83, 18.58, 13.12, 45.43],
color: colors[1]
}
}, {
y: 11.94,
color: colors[2],
drilldown: {
name: '鱼的种类',
categories: ['鲫鱼', '鲢鱼', '草鱼', '青鱼', '鲦鱼','鳙鱼', '鲥鱼'],
data: [41.12, 10.19, 11.12, 14.36, 21.32, 9.91, 17.50],
color: colors[2]
}
}, {
y: 7.15,
color: colors[3],
drilldown: {
name: '鸟的种类',
categories: ['松鸡', '卷尾', '鹪鹩', '岩鹨', '山鹑','画眉', '金鸡'],
data: [14.55, 19.42, 16.23, 16.21, 18.20, 23.19, 10.14],
color: colors[3]
}
}, {
y: 2.14,
color: colors[4],
drilldown: {
name: '鲸的种类',
categories: ['须鲸', '蓝鲸', '虎鲸'],
data: [ 24.12, 18.37, 32.65],
color: colors[4]
}
}];
// 构建物种数据
var speciesData = [];
var speData = [];
for (var i = 0; i < data.length; i++) {
// 添加物种数据
speciesData.push({
name: categories[i],
y: data[i].y,
color: data[i].color
});
for (var j = 0; j < data[i].drilldown.data.length; j++) {
var brightness = 0.4 - (j / data[i].drilldown.data.length) / 5 ;
speData.push({
name: data[i].drilldown.categories[j],
y: data[i].drilldown.data[j],
color: Highcharts.Color(data[i].color).brighten(brightness).get()
});
}
}
// 创建圆环图
$('#donutChart').highcharts({
chart: {
type: 'pie'
},
title: {
text: '物种数量及其比例'
},
yAxis: {
title: {
text: '比例'
}
},
plotOptions: {
pie: {
shadow: true,
center: ['50%', '50%']
}
},
tooltip: {
valueSuffix: '%'
},
series: [{
name: '物种',
data: speciesData,
size: '70%',
dataLabels: {
formatter: function() {
return this.y > 5 ? this.point.name : null;
},
color: 'white',
distance: -30
}
}, {
name: '数量',
data: speData,
size: '80%',
innerSize: '80%',
dataLabels: {
formatter: function() {
return this.y > 1 ? '<b>'+ this.point.name +':</b> '+ this.y +'%' : null;
}
}
}]
});
});
</script>
</head>
<body>
<p id="donutChart" style="width: 1250px; height: 550px; margin: 0 auto"></p>
</body>
</html>2. Operation rendering:
Related recommendations:
HighCharts draws 2D pie chart effect with Legend to share examples
Details on how to pass PHP dynamically transfers data to highcharts
Example code of highcharts usage
The above is the detailed content of HighCharts drawing 2D donut chart effect example sharing. For more information, please follow other related articles on the PHP Chinese website!

Hot AI Tools

Undresser.AI Undress
AI-powered app for creating realistic nude photos

AI Clothes Remover
Online AI tool for removing clothes from photos.

Undress AI Tool
Undress images for free

Clothoff.io
AI clothes remover

Video Face Swap
Swap faces in any video effortlessly with our completely free AI face swap tool!

Hot Article
Hot Tools

Notepad++7.3.1
Easy-to-use and free code editor

SublimeText3 Chinese version
Chinese version, very easy to use

Zend Studio 13.0.1
Powerful PHP integrated development environment

Dreamweaver CS6
Visual web development tools

SublimeText3 Mac version
God-level code editing software (SublimeText3)
Hot Topics
 1387
1387
 52
52

 SVM examples in Python
Jun 11, 2023 pm 08:42 PM
SVM examples in Python
Jun 11, 2023 pm 08:42 PM
Support Vector Machine (SVM) in Python is a powerful supervised learning algorithm that can be used to solve classification and regression problems. SVM performs well when dealing with high-dimensional data and non-linear problems, and is widely used in data mining, image classification, text classification, bioinformatics and other fields. In this article, we will introduce an example of using SVM for classification in Python. We will use the SVM model from the scikit-learn library
 How to use Sankey chart to display data in Highcharts
Dec 17, 2023 pm 04:41 PM
How to use Sankey chart to display data in Highcharts
Dec 17, 2023 pm 04:41 PM
How to use Sankey diagram to display data in Highcharts Sankey diagram (SankeyDiagram) is a chart type used to visualize complex processes such as flow, energy, and funds. It can clearly display the relationship and flow between various nodes, and can help us better understand and analyze data. In this article, we will introduce how to use Highcharts to create and customize a Sankey chart, with specific code examples. First, we need to load the Highcharts library and Sank
 How to use dynamic data in Highcharts to display real-time data
Dec 17, 2023 pm 06:57 PM
How to use dynamic data in Highcharts to display real-time data
Dec 17, 2023 pm 06:57 PM
How to use dynamic data in Highcharts to display real-time data. With the advent of the big data era, the display of real-time data has become more and more important. Highcharts, as a popular charting library, provides rich functions and customizability, allowing us to flexibly display real-time data. This article will introduce how to use dynamic data in Highcharts to display real-time data, and give specific code examples. First, we need to prepare a data source that can provide real-time data. In this article, I
 How to create a Gantt chart using Highcharts
Dec 17, 2023 pm 07:23 PM
How to create a Gantt chart using Highcharts
Dec 17, 2023 pm 07:23 PM
How to use Highcharts to create a Gantt chart requires specific code examples. Introduction: The Gantt chart is a chart form commonly used to display project progress and time management. It can visually display the start time, end time and progress of the task. Highcharts is a powerful JavaScript chart library that provides rich chart types and flexible configuration options. This article will introduce how to use Highcharts to create a Gantt chart and give specific code examples. 1. Highchart
 How to use stacked charts to display data in Highcharts
Dec 18, 2023 pm 05:56 PM
How to use stacked charts to display data in Highcharts
Dec 18, 2023 pm 05:56 PM
How to use stacked charts to display data in Highcharts Stacked charts are a common way of visualizing data, which can display the sum of multiple data series at the same time and display the contribution of each data series in the form of a bar chart. Highcharts is a powerful JavaScript library that provides a rich variety of charts and flexible configuration options to meet various data visualization needs. In this article, we will introduce how to use Highcharts to create a stacked chart and provide
 How to create a map heat map using Highcharts
Dec 17, 2023 pm 04:06 PM
How to create a map heat map using Highcharts
Dec 17, 2023 pm 04:06 PM
How to use Highcharts to create a map heat map requires specific code examples. A heat map is a visual data display method that can represent the data distribution in each area through different color shades. In the field of data visualization, Highcharts is a very popular JavaScript library that provides rich chart types and interactive functions. This article will introduce how to use Highcharts to create a map heat map and provide specific code examples. First, we need to prepare some data
 VUE3 Getting Started Example: Making a Simple Video Player
Jun 15, 2023 pm 09:42 PM
VUE3 Getting Started Example: Making a Simple Video Player
Jun 15, 2023 pm 09:42 PM
As the new generation of front-end frameworks continues to emerge, VUE3 is loved as a fast, flexible, and easy-to-use front-end framework. Next, let's learn the basics of VUE3 and make a simple video player. 1. Install VUE3 First, we need to install VUE3 locally. Open the command line tool and execute the following command: npminstallvue@next Then, create a new HTML file and introduce VUE3: <!doctypehtml>
 Learn best practice examples of pointer conversion in Golang
Feb 24, 2024 pm 03:51 PM
Learn best practice examples of pointer conversion in Golang
Feb 24, 2024 pm 03:51 PM
Golang is a powerful and efficient programming language that can be used to develop various applications and services. In Golang, pointers are a very important concept, which can help us operate data more flexibly and efficiently. Pointer conversion refers to the process of pointer operations between different types. This article will use specific examples to learn the best practices of pointer conversion in Golang. 1. Basic concepts In Golang, each variable has an address, and the address is the location of the variable in memory.
