

This article mainly introduces the method of dynamically drawing pie charts with JS+canvas, and analyzes the related operating techniques of js+canvas to realize pie chart drawing based on specific examples. Friends who are interested in JavaScript You can refer to this article.
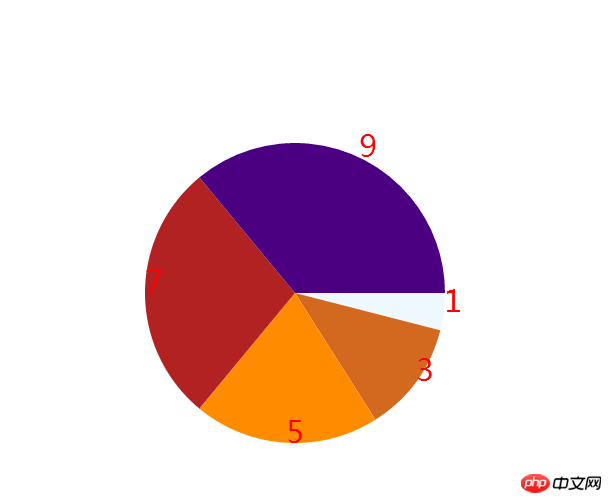
The running effect diagram is as follows:
Complete code:
<!DOCTYPE html>
<html lang="en">
<head>
<meta charset="UTF-8">
<title>www.php.cn canvas饼状图</title>
</head>
<body>
<canvas id="canvas" width="800" height="600" style="border:1px solid red"></canvas>
</body>
<script>
var colors = (function () {
return ( "aliceblue,antiquewhite,aqua,aquamarine,azure,beige,bisque,black,blanchedalmond,blue," +
"blueviolet,brown,burlywood,cadetblue,chartreuse,chocolate,coral,cornflowerblue,cornsilk," +
"crimson,cyan,darkblue,darkcyan,darkgoldenrod,darkgray,darkgreen,darkgrey,darkkhaki,darkmagenta," +
"darkolivegreen,darkorange,darkorchid,darkred,darksalmon,darkseagreen,darkslateblue,darkslategray," +
"darkslategrey,darkturquoise,darkviolet,deeppink,deepskyblue,dimgray,dimgrey,dodgerblue,firebrick," +
"floralwhite,forestgreen,fuchsia,gainsboro,ghostwhite,gold,goldenrod,gray,green,greenyellow,grey," +
"honeydew,hotpink,indianred,indigo,ivory,khaki,lavender,lavenderblush,lawngreen,lemonchiffon," +
"lightblue,lightcoral,lightcyan,lightgoldenrodyellow,lightgray,lightgreen,lightgrey,lightpink," +
"lightsalmon,lightseagreen,lightskyblue,lightslategray,lightslategrey,lightsteelblue,lightyellow," +
"lime,limegreen,linen,magenta,maroon,mediumaquamarine,mediumblue,mediumorchid,mediumpurple," +
"mediumseagreen,mediumslateblue,mediumspringgreen,mediumturquoise,mediumvioletred,midnightblue," +
"mintcream,mistyrose,moccasin,navajowhite,navy,oldlace,olive,olivedrab,orange,orangered,orchid," +
"palegoldenrod,palegreen,paleturquoise,palevioletred,papayawhip,peachpuff,peru,pink,plum,powderblue," +
"purple,rebeccapurple,red,rosybrown,royalblue,saddlebrown,salmon,sandybrown,seagreen,seashell,sienna," +
"silver,skyblue,slateblue,slategray,slategrey,snow,springgreen,steelblue,tan,teal,thistle,transparent," +
"tomato,turquoise,violet,wheat,white,whitesmoke,yellow,yellowgreen" ).split(',');
})();
function Bing(obj) {
this.start = 0;
for(var key in obj){
this[key] = obj[key];
}
this.init();
}
Bing.prototype = {
init: function () {
this.handle();
this.render(this.data2);
this.drawText();
},
/**
* 渲染页面
* @param obj
* @param i
*/
render: function (obj) {
//3、计算每一个扇形的起始弧度和结束弧度
this.data2.forEach(function (v, i) {
var obj = {};
//第一个扇形的起始弧度:start 结束:start+第一个扇形占据的弧度差
obj.start = this.start;
obj.end = this.start + v.radian;
this.start += v.radian;
//绘制扇形
this.ctx.beginPath();
this.ctx.moveTo(300, 300);
this.ctx.arc(300, 300, 150, obj.start, obj.end);
this.ctx.fillStyle = colors[i * 15];
this.ctx.fill();
}, this);
},
/**
* 处理数据
*/
handle:function(){
var sum = 0;
this.data.forEach(function (v) {
sum += v;
});
//2、计算每一个数据所占的比重
this.data2 = this.data.map(function (v) {
var obj = {};
obj.number = v;
obj.ratio = v / sum;//每个数据占据的比重
obj.radian = 2 * Math.PI * v / sum;//该扇形所占据的弧度
obj.start = this.start;
obj.end = this.start + obj.radian;
this.start = obj.end;
return obj;
},this);
},
drawText:function(){
this.ctx.font = "30px 微软雅黑";
this.ctx.fillStyle = 'red';
this.data2.forEach(function(obj){
//计算文字所在的弧度
r2 = obj.start + obj.radian/2;
//就按相对于圆心文字偏移的位置
b = this.r*Math.cos(r2);
h = this.r*Math.sin(r2);
//文字的位置
var x2 = this.x + b;
var y2 = this.y + h;
this.ctx.fillText(obj.number,x2,y2);
},this);
}
};
var canvas = document.querySelector('canvas');
var ctx = canvas.getContext('2d');
var data = [1, 3, 5, 7, 9];
var bing = new Bing({
ctx:ctx,
x:300,
y:300,
r:150,
data:data
});
</script>
</html>The above is all the content of this article, I hope to provide some information for everyone to learn to help! !
Related recommendations:
Detailed explanation of JavaScript priority queue and circular queue examples
JavaScript implementation of three-level cascading special effects example sharing
JavaScript to implement automatic music switching and carousel example tutorial
The above is the detailed content of Example of how to dynamically draw a pie chart using JS+canvas. For more information, please follow other related articles on the PHP Chinese website!


![[Web front-end] Node.js quick start](https://img.php.cn/upload/course/000/000/067/662b5d34ba7c0227.png)


