
 Web Front-end
JS Tutorial
Detailed explanation of the usage of jQuery plug-in echarts to remove vertical grid lines
Web Front-end
JS Tutorial
Detailed explanation of the usage of jQuery plug-in echarts to remove vertical grid lines
Detailed explanation of the usage of jQuery plug-in echarts to remove vertical grid lines

This article mainly introduces the usage of jQuery plug-in echarts to remove vertical grid lines, and compares and analyzes the jQuery icon plug-in echarts' related setting and operation skills for vertical grid lines in the form of examples. Friends who need it can refer to it. I hope it can help everyone. .
1. Problem background
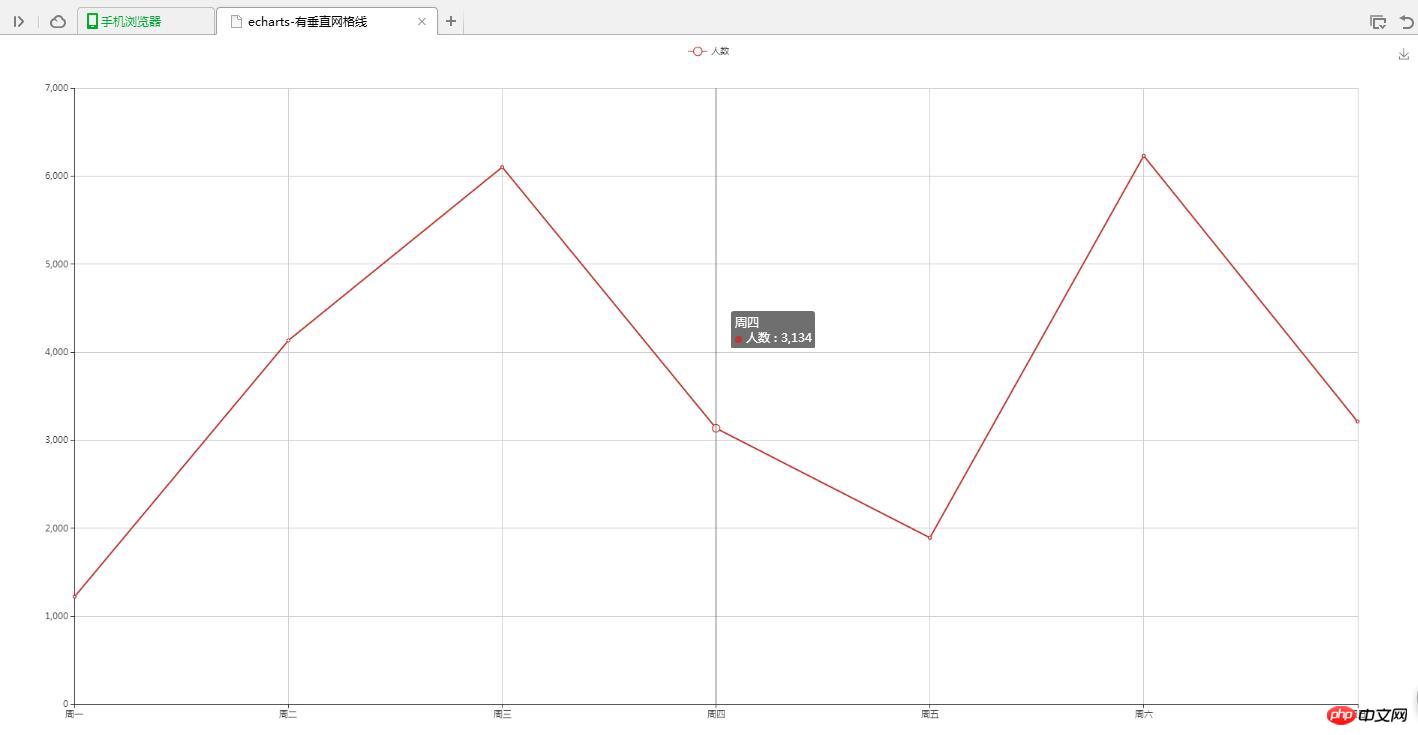
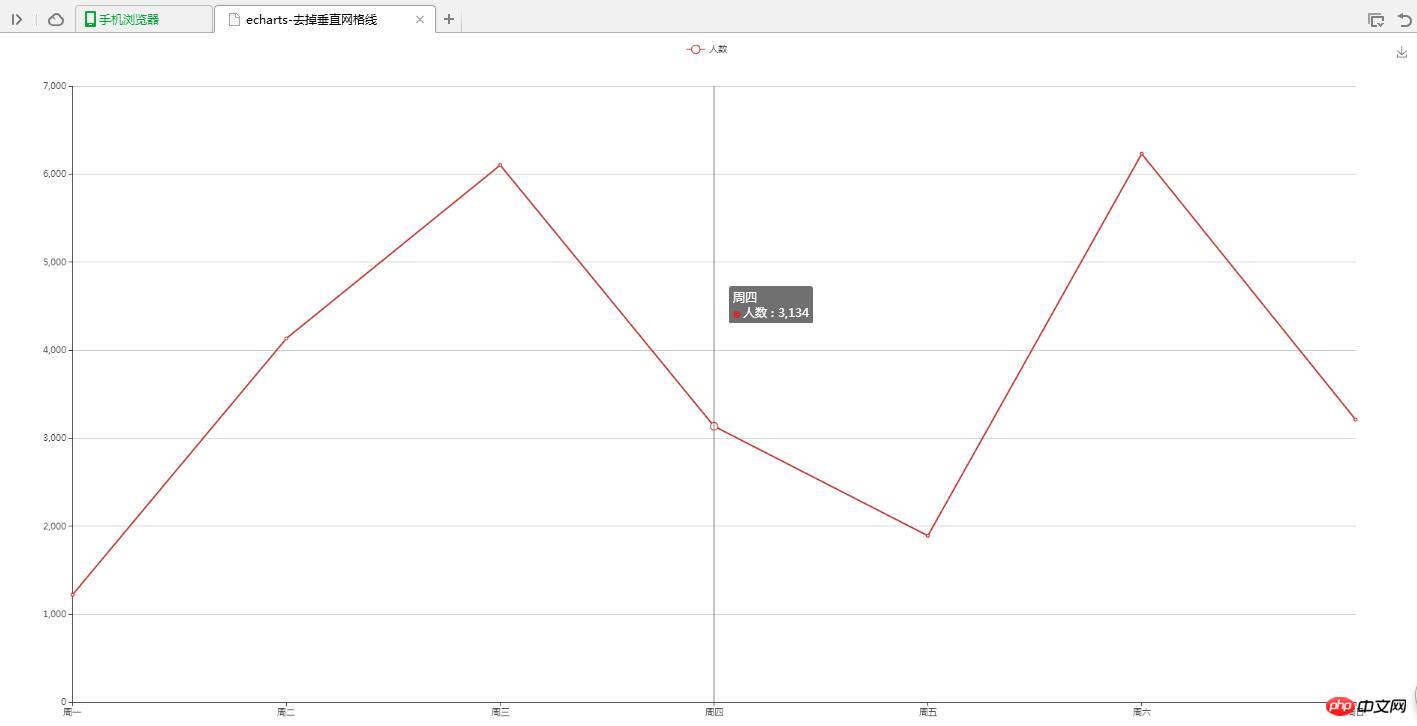
Design a polyline for counting people, in which the grid line has no vertical lines
2. Implementation source code
(1) With vertical grid lines
1 2 3 4 5 6 7 8 9 10 11 12 13 14 15 16 17 18 19 20 21 22 23 24 25 26 27 28 29 30 31 32 33 34 35 36 37 38 39 40 41 42 43 44 45 46 47 48 49 50 51 52 53 54 55 56 57 58 59 60 61 62 63 64 65 66 67 68 69 70 71 72 73 |
|
(2) Without vertical grid lines
1 2 3 4 5 6 7 8 9 10 11 12 13 14 15 16 17 18 19 20 21 22 23 24 25 26 27 28 29 30 31 32 33 34 35 36 37 38 39 40 41 42 43 44 45 46 47 48 49 50 51 52 53 54 55 56 57 58 59 60 61 62 63 64 65 66 67 68 69 70 71 72 73 |
|
3. Implementation results
(1) There are vertical grid lines
(2) No vertical grid lines
4. Problem description
To remove the vertical lines in the grid, just add the splitLine attribute setting to xAxisshow:false
Related recommendations:
Sharing of examples of loop generation chart effects implemented by echarts
Detailed explanation of the use of adding Echarts charts in vue
PHP uses Echarts to generate data statistics Report details
The above is the detailed content of Detailed explanation of the usage of jQuery plug-in echarts to remove vertical grid lines. For more information, please follow other related articles on the PHP Chinese website!

Hot AI Tools

Undresser.AI Undress
AI-powered app for creating realistic nude photos

AI Clothes Remover
Online AI tool for removing clothes from photos.

Undress AI Tool
Undress images for free

Clothoff.io
AI clothes remover

Video Face Swap
Swap faces in any video effortlessly with our completely free AI face swap tool!
Hot Article
Hot Tools

Notepad++7.3.1
Easy-to-use and free code editor

SublimeText3 Chinese version
Chinese version, very easy to use

Zend Studio 13.0.1
Powerful PHP integrated development environment

Dreamweaver CS6
Visual web development tools

SublimeText3 Mac version
God-level code editing software (SublimeText3)
Hot Topics
 1393
1393
 52
1206
24
52
1206
24

 Detailed explanation of jQuery reference methods: Quick start guide
Feb 27, 2024 pm 06:45 PM
Detailed explanation of jQuery reference methods: Quick start guide
Feb 27, 2024 pm 06:45 PM
Detailed explanation of jQuery reference method: Quick start guide jQuery is a popular JavaScript library that is widely used in website development. It simplifies JavaScript programming and provides developers with rich functions and features. This article will introduce jQuery's reference method in detail and provide specific code examples to help readers get started quickly. Introducing jQuery First, we need to introduce the jQuery library into the HTML file. It can be introduced through a CDN link or downloaded
 How to use PUT request method in jQuery?
Feb 28, 2024 pm 03:12 PM
How to use PUT request method in jQuery?
Feb 28, 2024 pm 03:12 PM
How to use PUT request method in jQuery? In jQuery, the method of sending a PUT request is similar to sending other types of requests, but you need to pay attention to some details and parameter settings. PUT requests are typically used to update resources, such as updating data in a database or updating files on the server. The following is a specific code example using the PUT request method in jQuery. First, make sure you include the jQuery library file, then you can send a PUT request via: $.ajax({u
 In-depth analysis: jQuery's advantages and disadvantages
Feb 27, 2024 pm 05:18 PM
In-depth analysis: jQuery's advantages and disadvantages
Feb 27, 2024 pm 05:18 PM
jQuery is a fast, small, feature-rich JavaScript library widely used in front-end development. Since its release in 2006, jQuery has become one of the tools of choice for many developers, but in practical applications, it also has some advantages and disadvantages. This article will deeply analyze the advantages and disadvantages of jQuery and illustrate it with specific code examples. Advantages: 1. Concise syntax jQuery's syntax design is concise and clear, which can greatly improve the readability and writing efficiency of the code. for example,
 How to remove the height attribute of an element with jQuery?
Feb 28, 2024 am 08:39 AM
How to remove the height attribute of an element with jQuery?
Feb 28, 2024 am 08:39 AM
How to remove the height attribute of an element with jQuery? In front-end development, we often encounter the need to manipulate the height attributes of elements. Sometimes, we may need to dynamically change the height of an element, and sometimes we need to remove the height attribute of an element. This article will introduce how to use jQuery to remove the height attribute of an element and provide specific code examples. Before using jQuery to operate the height attribute, we first need to understand the height attribute in CSS. The height attribute is used to set the height of an element
 jQuery Tips: Quickly modify the text of all a tags on the page
Feb 28, 2024 pm 09:06 PM
jQuery Tips: Quickly modify the text of all a tags on the page
Feb 28, 2024 pm 09:06 PM
Title: jQuery Tips: Quickly modify the text of all a tags on the page In web development, we often need to modify and operate elements on the page. When using jQuery, sometimes you need to modify the text content of all a tags in the page at once, which can save time and energy. The following will introduce how to use jQuery to quickly modify the text of all a tags on the page, and give specific code examples. First, we need to introduce the jQuery library file and ensure that the following code is introduced into the page: <
 Use jQuery to modify the text content of all a tags
Feb 28, 2024 pm 05:42 PM
Use jQuery to modify the text content of all a tags
Feb 28, 2024 pm 05:42 PM
Title: Use jQuery to modify the text content of all a tags. jQuery is a popular JavaScript library that is widely used to handle DOM operations. In web development, we often encounter the need to modify the text content of the link tag (a tag) on the page. This article will explain how to use jQuery to achieve this goal, and provide specific code examples. First, we need to introduce the jQuery library into the page. Add the following code in the HTML file:
 How to tell if a jQuery element has a specific attribute?
Feb 29, 2024 am 09:03 AM
How to tell if a jQuery element has a specific attribute?
Feb 29, 2024 am 09:03 AM
How to tell if a jQuery element has a specific attribute? When using jQuery to operate DOM elements, you often encounter situations where you need to determine whether an element has a specific attribute. In this case, we can easily implement this function with the help of the methods provided by jQuery. The following will introduce two commonly used methods to determine whether a jQuery element has specific attributes, and attach specific code examples. Method 1: Use the attr() method and typeof operator // to determine whether the element has a specific attribute
 Understand the role and application scenarios of eq in jQuery
Feb 28, 2024 pm 01:15 PM
Understand the role and application scenarios of eq in jQuery
Feb 28, 2024 pm 01:15 PM
jQuery is a popular JavaScript library that is widely used to handle DOM manipulation and event handling in web pages. In jQuery, the eq() method is used to select elements at a specified index position. The specific usage and application scenarios are as follows. In jQuery, the eq() method selects the element at a specified index position. Index positions start counting from 0, i.e. the index of the first element is 0, the index of the second element is 1, and so on. The syntax of the eq() method is as follows: $("s
