This article mainly introduces to you the sample code for using highcharts in angular. It is of great practical value. Friends who need it can refer to it. I hope it can help everyone.
Install dependencies
##
npm install highcharts-ng --save
##
'highcharts/highcharts.src.js',
'highcharts-ng/dist/highcharts-ng.min.js'
var myapp = angular.module('myapp', ["highcharts-ng"]);
// html
<highchart class="chart" config="chartConfig" class="span9" ></highchart>
// js
$scope.chartConfig = {
title: {
text: '哈哈哈',
x: -20
},
subtitle: {
text: 'Click and drag to zoom in.',
x: -20
},
xAxis: {
categories: ['一月', '二月', '三月', '四月', '五月', '六月', '七月', '八月', '九月', '十月', '十一月', '十二月']
},
yAxis: {
title: {
text: '温度 (°C)'
},
plotLines: [{
value: 0,
width: 1,
color: '#808080'
}]
},
tooltip: {
valueSuffix: '°C'
},
legend: {
layout: 'vertical',
align: 'right',
verticalAlign: 'middle',
borderWidth: 0
},
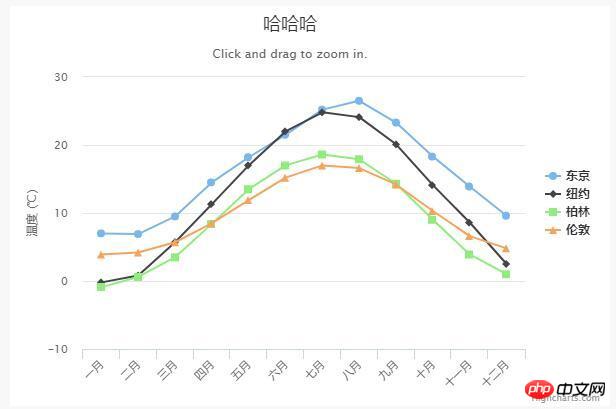
series: [{
name: '东京',
data: [7.0, 6.9, 9.5, 14.5, 18.2, 21.5, 25.2, 26.5, 23.3, 18.3, 13.9, 9.6]
}, {
name: '纽约',
data: [-0.2, 0.8, 5.7, 11.3, 17.0, 22.0, 24.8, 24.1, 20.1, 14.1, 8.6, 2.5]
}, {
name: '柏林',
data: [-0.9, 0.6, 3.5, 8.4, 13.5, 17.0, 18.6, 17.9, 14.3, 9.0, 3.9, 1.0]
}, {
name: '伦敦',
data: [3.9, 4.2, 5.7, 8.5, 11.9, 15.2, 17.0, 16.6, 14.2, 10.3, 6.6, 4.8]
}]
};Result
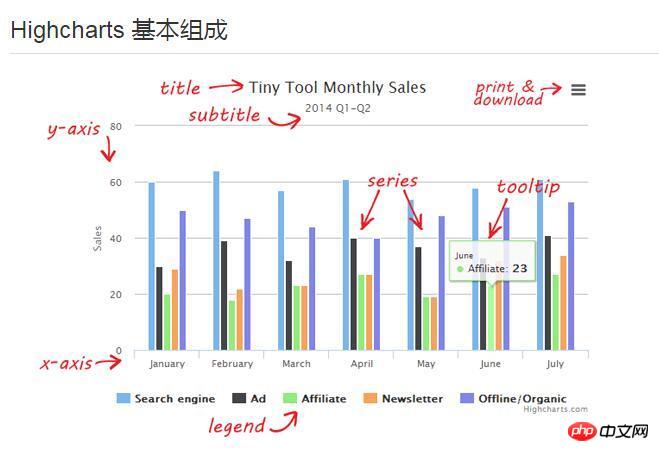
Basic composition of Highcharts
Related recommendations: 
HighCharts drawing 2D line chart with Label effect example sharing
Detailed explanation on how to dynamically transfer data to highcharts through php
PHP+mysql+Highcharts to implement pie chart_PHP tutorial
The above is the detailed content of How to use highcharts correctly in angular. For more information, please follow other related articles on the PHP Chinese website!


