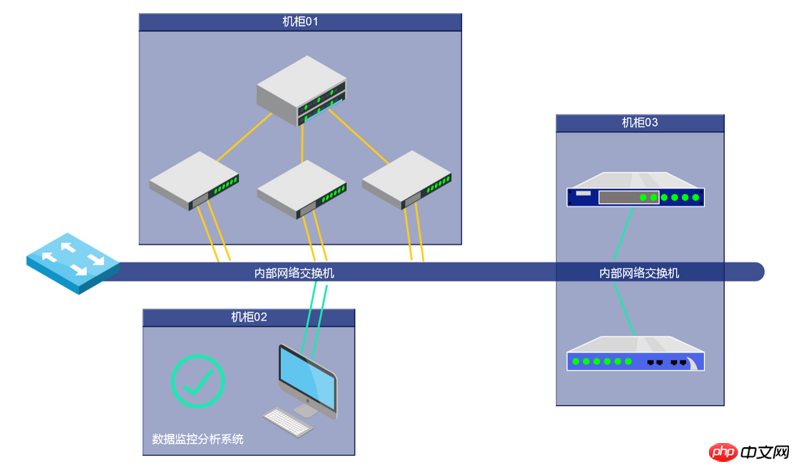
Telecommunication network structure refers to the combination logic and configuration form in which various network units of the telecommunications network are combined and configured according to technical requirements and economic principles. The combinational logic describes the architecture of network functions, and the configuration form describes the adjacency relationship of network units, that is, the topology composed of switching centers (or nodes) and transmission links. Common network topologies include star structure, bus structure, ring structure, tree structure, mesh structure, hybrid topology, cellular topology, etc. The examples in this article mainly depict the bus topology, which is relatively different in display than other network topologies. The structure types are clearer and easier to draw.
Although the title is named Telecom Network Topology Diagram, almost all topology diagrams can be covered, such as basic network diagrams, network topology diagrams, rack diagrams, network communication diagrams, 3D network diagrams, etc.
The rendering is as follows:

This picture looks quite simple, with less code, but a lot of content.
First of all, cabinet 01, cabinet 02, and cabinet 03 are all ht.Group "group" types. The ht.Group type is used as a parent container to contain child primitives. In the GraphView topology diagram (http: //www.hightopo.com) can be expanded and merged by double-clicking. The descendant primitive nodes will be hidden during the merge. If there are child nodes with connections to the outside, the merged Group will proxy the connection. The movement of the Group will drive the child nodes to follow, and changes in the child's position and size will also affect the Group's expanded shape and position.
Here is a question about agent connection. The word "agent" can well indicate the meaning of agent connection. In fact, if there is a connection between the node inside the group and the node outside the group, then when the group is merged, the connection between the group and the external node will be "proxyed". This is the proxy connection. Let's take cabinet 02 as an example. There is a "computer" inside cabinet 02 and there are two connections between the "internal network switch". So when we double-click cabinet 02 to merge, it is actually equivalent to cabinet 02 and the "internal network switch". There are two connections between the switches.
So, let’s take a look at how to draw this group and the nodes inside the group. First create the Group node of “Cabinet 02”, because I created three Group nodes in the entire example, and the creation methods are similar. , so the code for creating the group is encapsulated and reused:
function createGroup(name, x, y) {
    var group = new ht.Group();//组类型 实际上也是一个节点    group.setExpanded(true);//设置展开组    group.setName(name);//设置组的名字    group.s({//设置组的样式style        'group.title.background': 'rgba(14,36,117,0.80)',//组展开后的title背景颜色,仅对group.type为空的类型起作用        'group.background': 'rgba(14,36,117,0.40)',//组展开后的背景颜色        'group.title.align': 'center'//组展开后的title文字水平对齐方式,默认值为'left',可设置为center和right
    });    group.setPosition(x, y);//设置组的位置    group.setImage('images/服务器.json');//设置拓扑上展现的图片信息,在GraphView拓扑图中图片一般以position为中心绘制
    dataModel.add(group);//将创建的组节点添加进数据容器中

    return group;
}Groups can be expanded and merged by double-clicking, and will be displayed when expanded It is a box with a title bar (of course these can be customized). When merging, the picture in group.setImage set in the above code will be displayed.
All the nodes inside the cabinet are ht.Node type nodes, so I also encapsulated them:
function createNode(image, parent, x, y) {
    var node = new ht.Node();//创建一个 Node 节点
    if (image) node.setImage(image);//设置节点的显示图片
    if (parent) node.setParent(parent);//设置节点的父亲
    if (x && y) node.setPosition(x, y);//设置节点的位置
    dataModel.add(node);//将节点添加进数据容器中

    return node;
}Generate cabinet 02:

cabinet = createGroup('机柜02', 146, 445);//创建机柜02createNode('images/正常.json', cabinet, 78, 440).s('label', '数据监控分析系统');//创建带有“正常”图片的节点,并设置这个节点的文字为“数据监控分析系统”
Because of the wiring requirements are the "source node" and the "end node". The source node here is the "internal network switch" in the middle. Let's create this node again:
var line = createNode();//创建一个节点line.setSize(725, 20);//设置节点大小line.setPosition(310, 325);//设置节点位置line.s({//设置节点的style属性    'shape': 'roundRect',//决定shape的形状,默认值为空,代表用image绘制。roundRect四周圆角矩形    'shape.background': 'rgba(14,36,117,0.80)',//背景填充颜色,为null代表不填充背景    'shape.border.color': '#979797',//边框颜色    'shape.corner.radius': 10,//该参数指定roundRect类型的圆角半径,默认为空系统自动调节,可设置正数值    'label': '内部网络交换机', //文字内容,默认为空    'label.position': 45,//文字内容,默认为空    'label.offset.x': 50,//文字水平偏移,对于Edge意味着沿着连线方向水平偏移    'label2': '内部网络交换机',//HT默认除了label.*的属性外,还提供了label2.*的属性,用于满足一个图元需要显示双文字的情况    'label2.position': 48,    'label2.offset.x': 50,    'label2.offset.y': 2,
});I don’t know if you have noticed that there is a style attribute of label2. This is a function added by HT to add two label texts to a node. The label attribute is exactly the same as the attribute of label2. , just use label and label2 to distinguish them when setting attributes.
The source node and the end node are both available, and the connection can be made:
createEdge(line, createNode('images/电脑.json', cabinet, 185, 450), 'rgb(30,232,178)', -100, true);//参数1 源节点,参数2 终节点,参数3 连线颜色,参数4 连线起始点的水平偏移,参数5 是否创建两条连线
There is another interesting thing In the "switch" part, the blue square node on the far left and the long node in the middle are not integrated, but separated. However, I use setHost to adsorb between nodes, and then reverse adsorption back, so that Operationally, it is equivalent to the two nodes being one:
var exchange = createNode('images/交换机.json', null, -53, 313);
exchange.setHost(line);//设置吸附line.setHost(exchange);//反吸附 又设置line的吸附为exchange
因为 HT 会按照节点添加进数据容器中的顺序来进行层次的排列,我的交换机是在 line 的添加之后的,所以默认交换机的节点会显示在 line 之下,我们将默认的层级显示关闭,并设置交换机 exchange 显示在数据容器的顶部:
dataModel.setAutoAdjustIndex(false);//将自动调整data在容器中索引顺序的开关关闭dataModel.sendToTop(exchange);//将data在拓扑上置顶
相关推荐:


