

D3.js implementation of dynamic progress bar example

The full name of D3 is (Data-Driven Documents). As the name suggests, you can know that it is a document driven by data. The name sounds a bit abstract, but to put it simply, it is actually a JavaScript function library. It is mainly used for data visualization. If you don’t know what JavaScript is, please learn JavaScript first and recommend teacher Ruan Yifeng’s tutorial.
The suffix of JavaScript files is usually .js, so D3 is often called D3.js. D3 provides a variety of simple and easy-to-use functions, which greatly simplifies the difficulty of operating data in JavaScript. Since it is essentially JavaScript, all functions can be implemented using JavaScript, but it can greatly reduce your workload, especially in data visualization. D3 has reduced the complex steps of generating visualizations to a few simple functions. , you only need to enter a few simple data to convert it into a variety of gorgeous graphics. Friends who have basic knowledge of JavaScript will easily understand it.
We often use svg or canvas to draw dynamic graphics, but the drawing process is relatively cumbersome. For intuitive and beautiful progress bars, the community also provides mature solutions such as highcharts/ECharts, etc., but the configuration-based development method cannot achieve 100% customized drawing. This article will take you step by step to implement a dynamic progress bar from scratch using D3.js, and share the code logic principles.
Basic requirements
Understand how svg draws basic graphics
Understand the D3.js v4 version
Learn how to use D3.js (v4) to draw the basic graphics of svg
Draw a circular progress bar
For a circle For the progress bar, we first split the tasks:
Drawing nested arcs
-
Real-time data display at the center of the circle
Display animation
Beautification
1. Draw nested arcs
For For circles, SVG provides ready-made circle tags for use, but its disadvantage is that using circle can satisfy the circular progress bar, but when the graphics is further expanded, such as drawing a semicircle, the processing of circle is tricky. D3.js provides arc related API to encapsulate the circle drawing method:
var arc = d3.arc()
   .innerRadius(180)
   .outerRadius(240)
   //.startAngle(0)
   //.endAngle(Math.PI)
arc(); // "M0,-100A100,100,0,0,1,100,0L0,0Z"
The above code implements the drawing logic of two nested circles, d3.arc() returns an arc constructor, And set the radius of the inner circle and the outer circle, the starting angle and the ending angle through chain calls. Execute the arc() constructor to obtain path data for binding on
<!--html-->
<svg width="960" height="500"></svg>
<script>
 var arcGenerator = d3.arc().innerRadius(80).outerRadius(100).startAngle(0);
 var picture = d3.select('svg').append('g').attr('transform','translate(480,250)');
</script>The above code implements 2 steps:
1. Generate an arc constructor arcGenerator with 0 degrees as the starting point
2. Set the transform graphic Offset, so that the graphic is in the center of the canvas
Currently there are no elements on the canvas, next we draw the actual graphic.
var backGround = picture.append("path")
  .datum({endAngle: 2 * Math.PI})
  .style("fill", "#FDF5E6")
.attr("d", arcGenerator); We add the

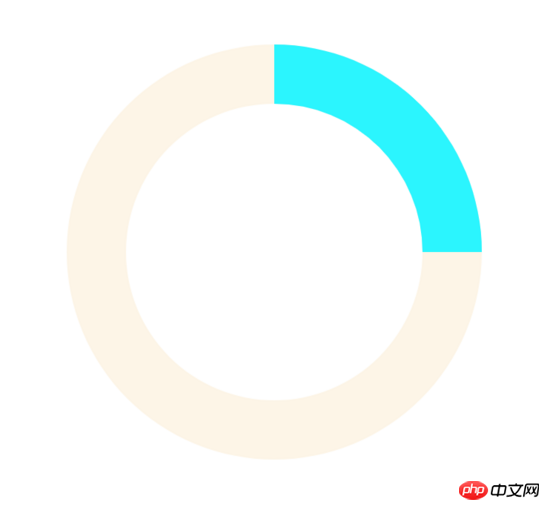
The first arc is drawn, then according to the hierarchical relationship z-index of svg, the so-called The progress bar is actually the second layer of arcs covering the first layer of arcs. In the same way, you can get:
var upperGround = picture.append('path')
  .datum({endAngle:Math.PI / 2})
  .style('fill','#FFC125')
.attr('d',arcGenerator)After running the code, you can get:
2. Real-time data display at the center of the circle
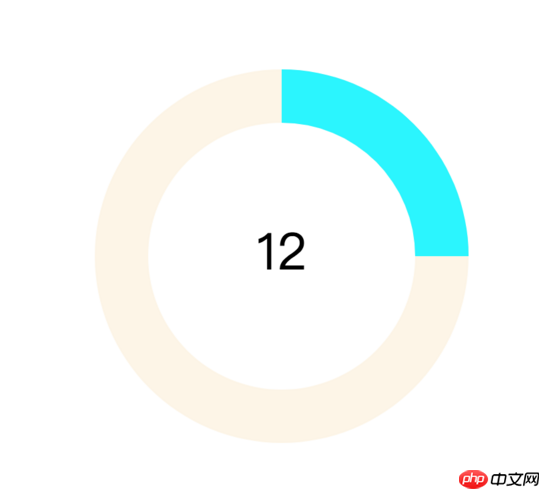
Part 1 We Nested circles based on two paths have been implemented. In the second part, we will implement real-time data display at the center of the circle. When the progress bar is loading, we add data at the center of the circle to express the current loading progress, and use the
var dataText = g.append('text')
  .text(12)
  .attr('text-anchor','middle')
  .attr('dominant-baseline','middle')
.attr('font-size','38px')Temporarily set the data to 12, and set the horizontal centering and Vertically centered, the effect is as follows:
3. Display animation
We already know the contents of parts 1 and 2:
The essence of drawing the progress bar is to change the angle of the upper arc
When the radian is 2π, it is a full circle, and when the radian is π, it is a semicircle
The data in the circle is the percentage of the current radian relative to 2π
In summary, we only need to change the radian value and numerical value and set the time required for the change process. Can realize so-called "animation". In the official example provided by ECharts, setInterval is used to update data every fixed period of time. In fact, D3.js also provides a similar method to implement functions similar to setInterval:
d3.interval(function(){
 foreground.transition().duration(750).attrTween('d',function(d){
  var compute = d3.interpolate(d.endAngle,Math.random() * Math.PI * 2);
  return function(t){
   d.endAngle = compute(t);
   return arcGenerator(d);
  }

 })
},1000)For this code Dismantle:
d3.interval() method provides the function of setInterval()
selection.transition.duration() is set The time required for the transition of the current DOM attribute to the specified DOM attribute, in milliseconds.
transation.attrTween is the interpolation function API, so what is interpolation?
概括来说,在给定的离散数据中补插函数,可以使这条连续函数通过全部数据点。举个例子,给定一个p,想实现其背景颜色的从左边红(red)到右边绿(green)的线性渐变,每一区域的色值该如何计算呢?只需:
var compute = d3.interpolate(d3.rgb(255,0,0),d3.rgb(0,255,0));
compute 即为插值函数,参数范围为[0,1],只要你输入该范围内的数字,那么 compute 函数将返回对应的颜色值。这样的插值有什么用呢?可看下图:

假设上图的p长度width为100,那么将[0,100]依比例关系转化为[0,10]的范围数据并输入 compute 函数中,即可得到某一区域对应的颜色。当然,对于线性面积的处理我们不应该使用离散数据作为输入和输出,所以D3.js提供更方便的线性渐变API d3.linear 等,这里就不展开描述了。
言归正传,代码 d3.interpolate(d.endAngle,Math.random() * Math.PI * 2); 实现了如下插值范围:
["当前角度值","随机角度值"] //表达区间而非数组
而后返回一个参数为 t 的函数,那么该函数的作用是什么呢?
t 参数与 d 类似,是D3.js内部实现的插值,其范围为[0,1]。 t 参数根据设置的 duration() 时长自动计算在[0,1]内合适的插值数量,并返回插值结果,实现线性平稳的过渡动画效果。
完成滚动条的动画加载效果,我们接下来写圆心实时数据的变化逻辑,只要实现简单的赋值即可,完整代码如下:
d3.interval(function(){
  foreground.transition().duration(750).attrTween('d',function(d){
   var compute = d3.interpolate(d.endAngle,Math.random() * Math.PI * 2);
   return function(t){
    d.endAngle = compute(t);
    var data = d.endAngle / Math.PI / 2 * 100;
    //设置数值
    d3.select('text').text(data.toFixed(0) + '%');
    //将新参数传入,生成新的圆弧构造器
    return arcGenerator(d);
   }
  })
},2000)最终效果如下:
4.美化
1,2,3部分我们实现了最基本的进度条样式和功能,但样式看起来还是很单调的,我们接下来我们对进度条进行线性渐变处理。我们使用D3.js提供的线性插值API:
var colorLinear = d3.scaleLinear().domain([0,100]).range(["#EEE685","#EE3B3B"]);
colorLinear 同样是一个插值函数,我们输入[0,100]区间中的数值,就会返回对应["#EEE685","#EE3B3B"]区间内的颜色值。比如当进度条显示进度为"80%"时:
var color = colorLinear(80);
//color即为"80%"对应的色值
实现了颜色取值后,我们只需在进度条变化时,将原有颜色改变即可:
d3.interval(function(){
  foreground.transition().duration(750).attrTween('d',function(d){
   var compute = d3.interpolate(d.endAngle,Math.random() * Math.PI * 2);
   return function(t){
    d.endAngle = compute(t);
    var data = d.endAngle / Math.PI / 2 * 100;
    //设置数值
    d3.select('text').text(data.toFixed(0) + '%');
    //将新参数传入,生成新的圆弧构造器
    return arcGenerator(d);
   }
  })
  .styleTween('fill',function(d){
   return function(t){
    var data = d.endAngle / Math.PI / 2 * 100;
    //返回数值对应的色值
    return colorLinear(data);
   }
  })
},2000)styleTween 与 attrTween 类似,是实现改变样式的插值函数。采用链式调用的形式同时对进度条数值和颜色的设置即可。最终实现的效果如下:

综上我们实现了在不同数值下颜色变化的圆形进度条,可常用于告警,提醒等业务场景。
绘制矩形进度条
矩形进度条相比圆形进度条简单了很多,同样基于插值原理,平滑改变矩形的长度即可。直接上代码:
<head>
<style>
#slider {
height: 20px;
width: 20px;
background: #2394F5;
margin: 15px;
}
</style>
</head>
<body>
<p id='slider'></p>
<script>
d3.interval(function(){
d3.select("#slider").transition()
.duration(1000)
.attrTween("width", function() {
var i = d3.interpolate(20, 400);
var ci = d3.interpolate('#2394F5', '#BDF436');
var that = this;
return function(t) {
that.style.width = i(t) + 'px';
that.style.background = ci(t);
};
});
},1500)
</script>
</body>实现的效果如下:

总结
基于D3.js绘制进度条的关键点在于插值,从而正确地使图形平滑过渡。如果一定要使用svg或纯css实现矩形和圆形的进度条当然也是可行的,但对于路径和动画的处理,以及css的书写要求都复杂了不少。我们观察到使用D3.js绘制上述两种进度条的逻辑代码几乎完全使用js实现,同时代码量可以控制在20行左右并可封装复用,已经非常精炼了,在自定义图表开发上非常有优势。
对于进度条的衍生版仪表盘图表,相比基础进度条增加了刻度描述和指针计算,但万变不离其宗,只要掌握插值原理和使用,处理类似图表都将得心应手。
相关推荐:
基于jquery的多彩百分比 动态进度条 投票效果显示效果实现代码_jquery
The above is the detailed content of D3.js implementation of dynamic progress bar example. For more information, please follow other related articles on the PHP Chinese website!

Hot AI Tools

Undresser.AI Undress
AI-powered app for creating realistic nude photos

AI Clothes Remover
Online AI tool for removing clothes from photos.

Undress AI Tool
Undress images for free

Clothoff.io
AI clothes remover

AI Hentai Generator
Generate AI Hentai for free.

Hot Article
Hot Tools

Notepad++7.3.1
Easy-to-use and free code editor

SublimeText3 Chinese version
Chinese version, very easy to use

Zend Studio 13.0.1
Powerful PHP integrated development environment

Dreamweaver CS6
Visual web development tools

SublimeText3 Mac version
God-level code editing software (SublimeText3)
Hot Topics
 1382
1382
 52
52

 How to implement an online speech recognition system using WebSocket and JavaScript
Dec 17, 2023 pm 02:54 PM
How to implement an online speech recognition system using WebSocket and JavaScript
Dec 17, 2023 pm 02:54 PM
How to use WebSocket and JavaScript to implement an online speech recognition system Introduction: With the continuous development of technology, speech recognition technology has become an important part of the field of artificial intelligence. The online speech recognition system based on WebSocket and JavaScript has the characteristics of low latency, real-time and cross-platform, and has become a widely used solution. This article will introduce how to use WebSocket and JavaScript to implement an online speech recognition system.
 WebSocket and JavaScript: key technologies for implementing real-time monitoring systems
Dec 17, 2023 pm 05:30 PM
WebSocket and JavaScript: key technologies for implementing real-time monitoring systems
Dec 17, 2023 pm 05:30 PM
WebSocket and JavaScript: Key technologies for realizing real-time monitoring systems Introduction: With the rapid development of Internet technology, real-time monitoring systems have been widely used in various fields. One of the key technologies to achieve real-time monitoring is the combination of WebSocket and JavaScript. This article will introduce the application of WebSocket and JavaScript in real-time monitoring systems, give code examples, and explain their implementation principles in detail. 1. WebSocket technology
 How to use JavaScript and WebSocket to implement a real-time online ordering system
Dec 17, 2023 pm 12:09 PM
How to use JavaScript and WebSocket to implement a real-time online ordering system
Dec 17, 2023 pm 12:09 PM
Introduction to how to use JavaScript and WebSocket to implement a real-time online ordering system: With the popularity of the Internet and the advancement of technology, more and more restaurants have begun to provide online ordering services. In order to implement a real-time online ordering system, we can use JavaScript and WebSocket technology. WebSocket is a full-duplex communication protocol based on the TCP protocol, which can realize real-time two-way communication between the client and the server. In the real-time online ordering system, when the user selects dishes and places an order
 How to implement an online reservation system using WebSocket and JavaScript
Dec 17, 2023 am 09:39 AM
How to implement an online reservation system using WebSocket and JavaScript
Dec 17, 2023 am 09:39 AM
How to use WebSocket and JavaScript to implement an online reservation system. In today's digital era, more and more businesses and services need to provide online reservation functions. It is crucial to implement an efficient and real-time online reservation system. This article will introduce how to use WebSocket and JavaScript to implement an online reservation system, and provide specific code examples. 1. What is WebSocket? WebSocket is a full-duplex method on a single TCP connection.
 JavaScript and WebSocket: Building an efficient real-time weather forecasting system
Dec 17, 2023 pm 05:13 PM
JavaScript and WebSocket: Building an efficient real-time weather forecasting system
Dec 17, 2023 pm 05:13 PM
JavaScript and WebSocket: Building an efficient real-time weather forecast system Introduction: Today, the accuracy of weather forecasts is of great significance to daily life and decision-making. As technology develops, we can provide more accurate and reliable weather forecasts by obtaining weather data in real time. In this article, we will learn how to use JavaScript and WebSocket technology to build an efficient real-time weather forecast system. This article will demonstrate the implementation process through specific code examples. We
 Simple JavaScript Tutorial: How to Get HTTP Status Code
Jan 05, 2024 pm 06:08 PM
Simple JavaScript Tutorial: How to Get HTTP Status Code
Jan 05, 2024 pm 06:08 PM
JavaScript tutorial: How to get HTTP status code, specific code examples are required. Preface: In web development, data interaction with the server is often involved. When communicating with the server, we often need to obtain the returned HTTP status code to determine whether the operation is successful, and perform corresponding processing based on different status codes. This article will teach you how to use JavaScript to obtain HTTP status codes and provide some practical code examples. Using XMLHttpRequest
 JavaScript and WebSocket: Building an efficient real-time image processing system
Dec 17, 2023 am 08:41 AM
JavaScript and WebSocket: Building an efficient real-time image processing system
Dec 17, 2023 am 08:41 AM
JavaScript is a programming language widely used in web development, while WebSocket is a network protocol used for real-time communication. Combining the powerful functions of the two, we can create an efficient real-time image processing system. This article will introduce how to implement this system using JavaScript and WebSocket, and provide specific code examples. First, we need to clarify the requirements and goals of the real-time image processing system. Suppose we have a camera device that can collect real-time image data
 Learn best practice examples of pointer conversion in Golang
Feb 24, 2024 pm 03:51 PM
Learn best practice examples of pointer conversion in Golang
Feb 24, 2024 pm 03:51 PM
Golang is a powerful and efficient programming language that can be used to develop various applications and services. In Golang, pointers are a very important concept, which can help us operate data more flexibly and efficiently. Pointer conversion refers to the process of pointer operations between different types. This article will use specific examples to learn the best practices of pointer conversion in Golang. 1. Basic concepts In Golang, each variable has an address, and the address is the location of the variable in memory.
