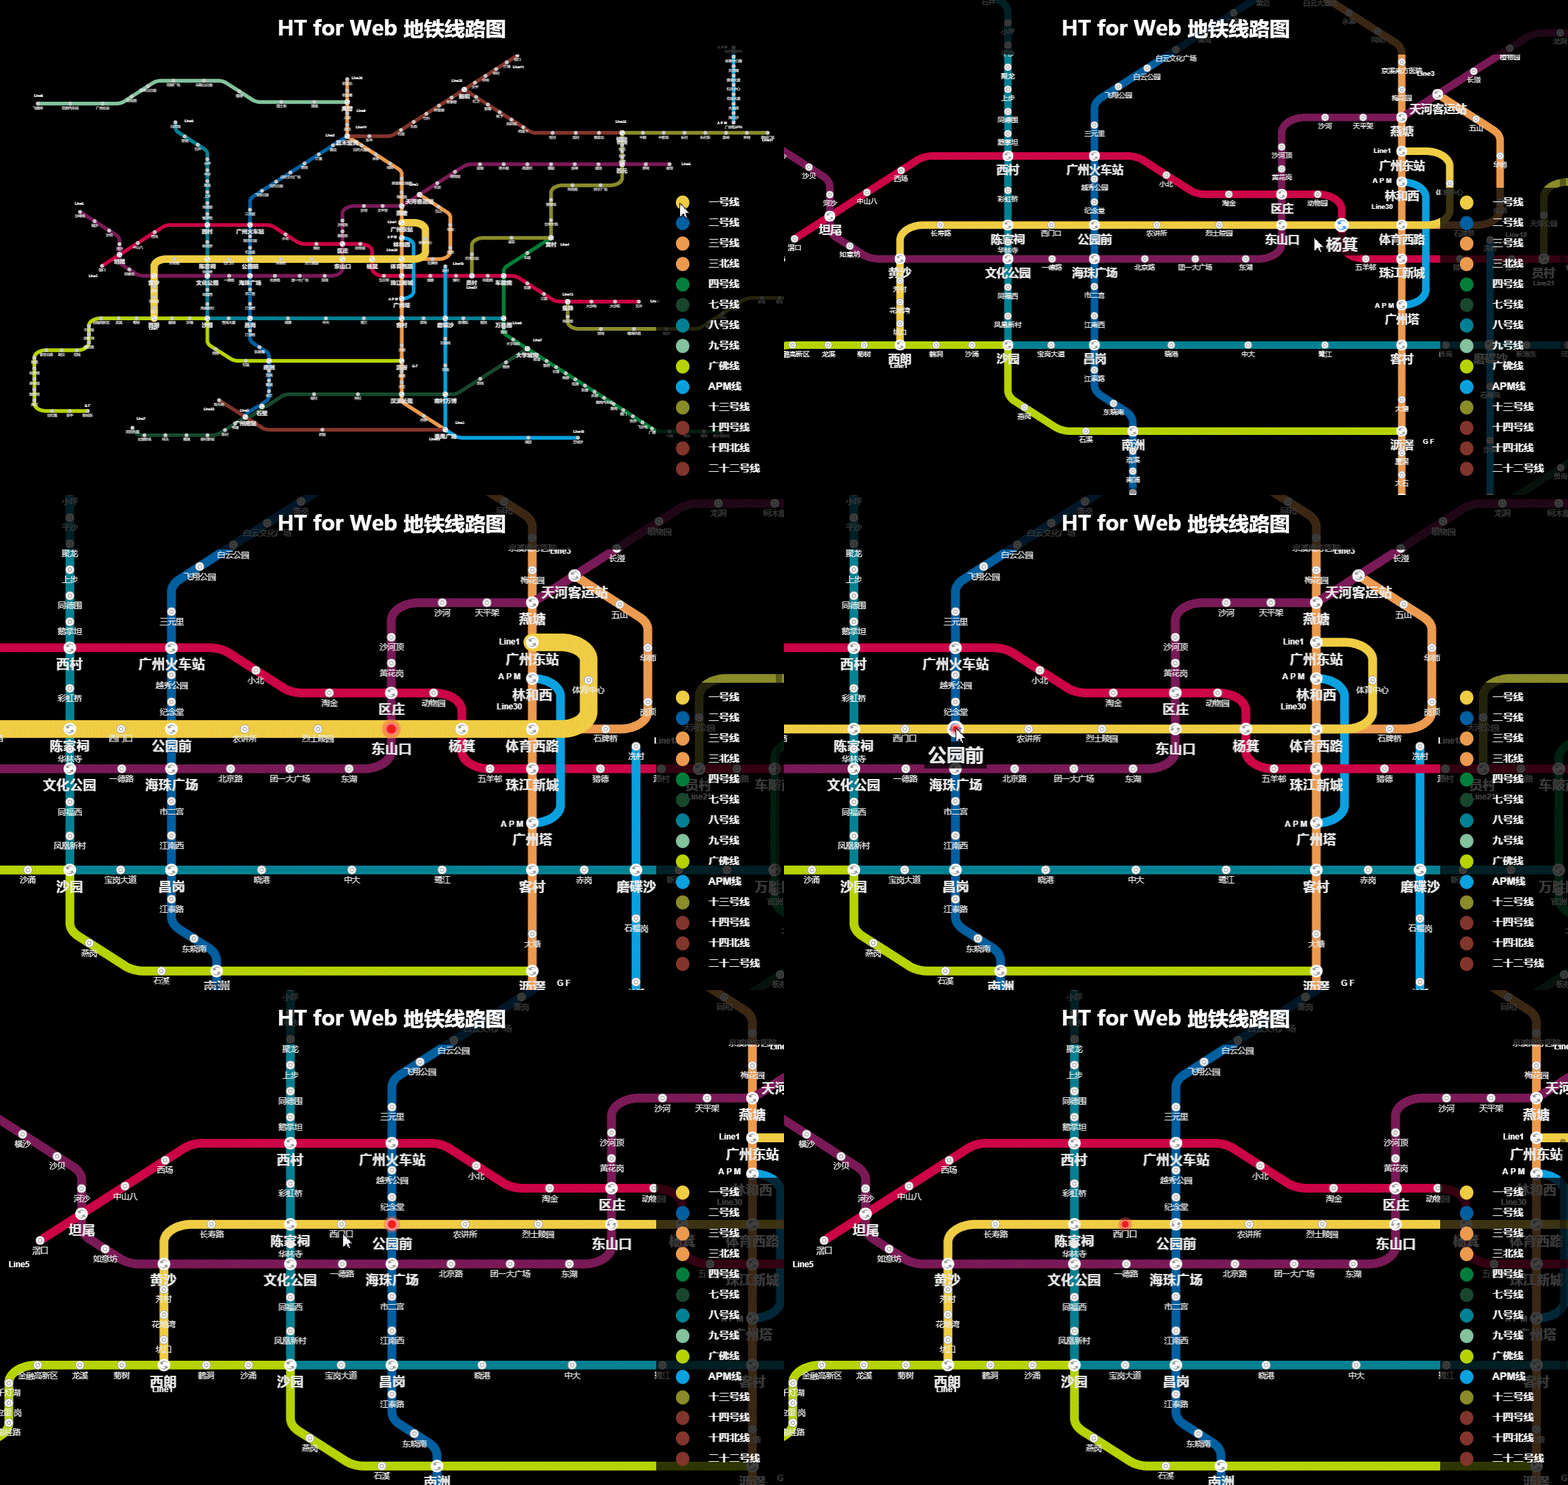
The map has a little too much content. If you want to display it all, the fonts will appear a bit small, but it doesn't matter. You can zoom in and out as needed. The fonts and drawn content will not be distorted. After all, they are all drawn with vectors. The~
The underlying p is generated through the ht.graph.GraphView component, and then you can use the good methods provided by HT for Web to call the canvas brush to draw casually. Let’s first look at how to generate the underlying p:
var dm = new ht.DataModel();//数据容器
var gv = new ht.graph.GraphView(dm);//拓扑组件
gv.addToDOM();//将拓扑图组件添加进body中
The addToDOM function is declared as follows:
addToDOM = function(){
    var self = this,
        view = self.getView(),
        style = view.style;
    document.body.appendChild(view); //将组件底层p添加到body中
    style.left = '0';//默认组件是绝对定位,所以要设置位置
    style.right = '0';
    style.top = '0';
    style.bottom = '0';
    window.addEventListener('resize', function () { self.iv(); }, false); //窗口变化事件
}Now I can scribble on this p~ First I get the downloaded subway line For the points on the map, I put them in subway.js. This js file is all the downloaded content. I did not make any other changes. The main thing is to add these points to the array according to the lines, such as:
mark_Point13 = [];//线路 数组内包含线路的起点和终点坐标以及这条线路的名称
t_Point13 = [];//换成站点 数组内包含线路中的换乘站点坐标以及换成站点名称
n_Point13 = [];//小站点 数组内包含线路中的小站点坐标以及小站点名称
mark_Point13.push({ name: '十三号线', value: [113.4973,23.1095]});
mark_Point13.push({ name: '十三号线', value: [113.4155,23.1080]});
t_Point13.push({ name: '鱼珠', value: [113.41548,23.10547]});
n_Point13.push({ name: '裕丰围', value: [113.41548,23.10004]});Next to describe the subway lines, I declared an array lineNum to hold the numbers of all the subway lines in js, and a color array to hold the colors of all the subway lines. These colors There is a one-to-one correspondence between index and the index of the subway line number in lineNum:
var lineNum = ['1', '2', '3', '30', '4', '5', '6', '7', '8', '9', '13', '14', '32', '18', '21', '22', '60', '68'];
var color = ['#f1cd44', '#0060a1', '#ed9b4f', '#ed9b4f', '#007e3a', '#cb0447', '#7a1a57',
 '#18472c', '#008193', '#83c39e', '#8a8c29', '#82352b', '#82352b', '#09a1e0', '#8a8c29',
 '#82352b', '#b6d300', '#09a1e0'];
Then traverse lineNum, pass the elements and colors in lineNum to the createLine function, and draw the subway line and color matching based on these two parameters. , after all, the naming method in js files is also regular. For which line, the corresponding number will be added after the name, so we only need to combine the string with this number to obtain the corresponding array in js:
let lineName = 'Line' + num;
let line = window[lineName];
The definition of createLine is also very simple. My code has a lot of styles, so it looks a bit much. Create an ht.Polyline pipeline. We can add specific points to this variable through the polyline.addPoint() function, and set the connection method of the points through setSegments.
function createLine(num, color) {//绘制地图线
    var polyline = new ht.Polyline();//多边形 管线
    polyline.setTag(num);//设置节点tag标签,作为唯一标示

    if(num === '68') polyline.setToolTip('A P M');//设置提示信息
    else if(num === '60') polyline.setToolTip('G F');
    else polyline.setToolTip('Line' + num);

    if(color) {
        polyline.s({//s 为 setStyle 的简写,设置样式
            'shape.border.width': 0.4,//设置多边形的边框宽度
            'shape.border.color': color,//设置多边形的边框颜色
            'select.width': 0.2,//设置选中节点的边框宽度
            'select.color': color//设置选中节点的边框颜色
        });
    }

    let lineName = 'Line' + num;
    let line = window[lineName];
    for(let i = 0; i < line.length; i++) {
        for(let j = 0; j < line[i].coords.length; j++) {
            polyline.addPoint({x: line[i].coords[j][0]*300, y: -line[i].coords[j][1]*300});
            if(num === '68'){//APM线(有两条,但是点是在同一个数组中的)
                if(i === 0 && j === 0) {
                    polyline.setSegments([1]);
                }
                else if(i === 1 && j === 0) {
                    polyline.getSegments().push(1);
                }
                else {
                    polyline.getSegments().push(2);
                }
            }
        }
    }

    polyline.setLayer('0');//将线设置在下层,点设置在上层“top”
    dm.add(polyline);//将管线添加进数据容器中储存,不然这个管线属于“游离”状态,是不会显示在拓扑图上的
    return polyline;
}There are several situations in adding points on the subway line in the above code. This is because Line68 has a "jumping" point when setting the line in js, so we must "jump" over it. Please refer to subway.js for the specific declaration of limited Line68 array.
One thing to note here is that if you use the addPoint function and do not set segments, the added points will be connected with straight lines by default. The definition of segments is as follows:
1 : moveTo, occupies 1 point information, represents the starting point of a new path
2: lineTo, occupies 1 point information, represents the connection from the last point to this point
3: quadraticCurveTo, occupies 2 point information, the first point is used as the curve control point, and the second point is used as the curve end point
4: bezierCurveTo, occupies 3 point information, the first and second points are used as curve control points, and the third point is used as the curve end point
5: closePath, does not occupy point information, represents This time the path is drawn and closed to the starting point of the path
So we want to do the "jumping" behavior by setting segments to 1.
Finally draw these points on the subway line. This part is also separated in subway.js. The names start with "mark_Point", "t_Point" and "n_Point". I have the right ones in the display part of the previous js. These arrays are explained, and everyone moves their middle fingers to scroll up and take a look.
We add ht.Node nodes at these points. When the nodes are added to the dm data container, they will be displayed on the topology map. Of course, the premise is that the data container set by the topology map component gv It’s this DM. Due to limited space, I only show the code part for adding points on the subway line:
var tName = 't_Point' + num;
var tP = window[tName];//大站点
if(tP) {//有些线路没有“换乘站点”
    for(let i = 0; i < tP.length; i++) {
        let node = createNode(tP[i].name, tP[i].value, color[index]);//在获取的线路上的点的坐标位置添加节点
        node.s({//设置节点的样式style
            'label.scale': 0.05,//文本缩放,可以避免浏览器限制的最小字号问题
            'label.font': 'bold 12px arial, sans-serif'//设置文本的font
        });
        node.setSize(0.6, 0.6);//设置节点大小。由于js中每个点之间的偏移量太小,所以我不得不把节点设置小一些
        node.setImage('images/旋转箭头.json');//设置节点的图片
        node.a('alarmColor1', 'rgb(150, 150, 150)');//attr属性,可以在这里面设置任何的东西,alarmColor1是在上面设置的image的json中绑定的属性,具体参看 HT for Web 矢量手册(http://www.hightopo.com/guide/guide/core/vector/ht-vector-guide.html#ref_binding)
        node.a('alarmColor2', 'rgb(150, 150, 150)');//同上
        node.a('tpNode', true);//这个属性设置只是为了用来区分“换乘站点”和“小站点”的,后面会用上
    }
}All subway lines and stations have been added. but! You may not be able to see the graphs you drew because they are too small. At this time, you can set the fitContent function on the graphView topology component. By the way, we also set everything on the topology graph to be immovable:
gv.fitContent(false, 0.00001);//自适应大小,参数1为是否动画,参数2为gv与边框的padding值
gv.setMovableFunc(function(){
    return false;//设置gv上的节点不可移动
});Now your subway route map can be displayed~ Let’s take a look at the interaction.
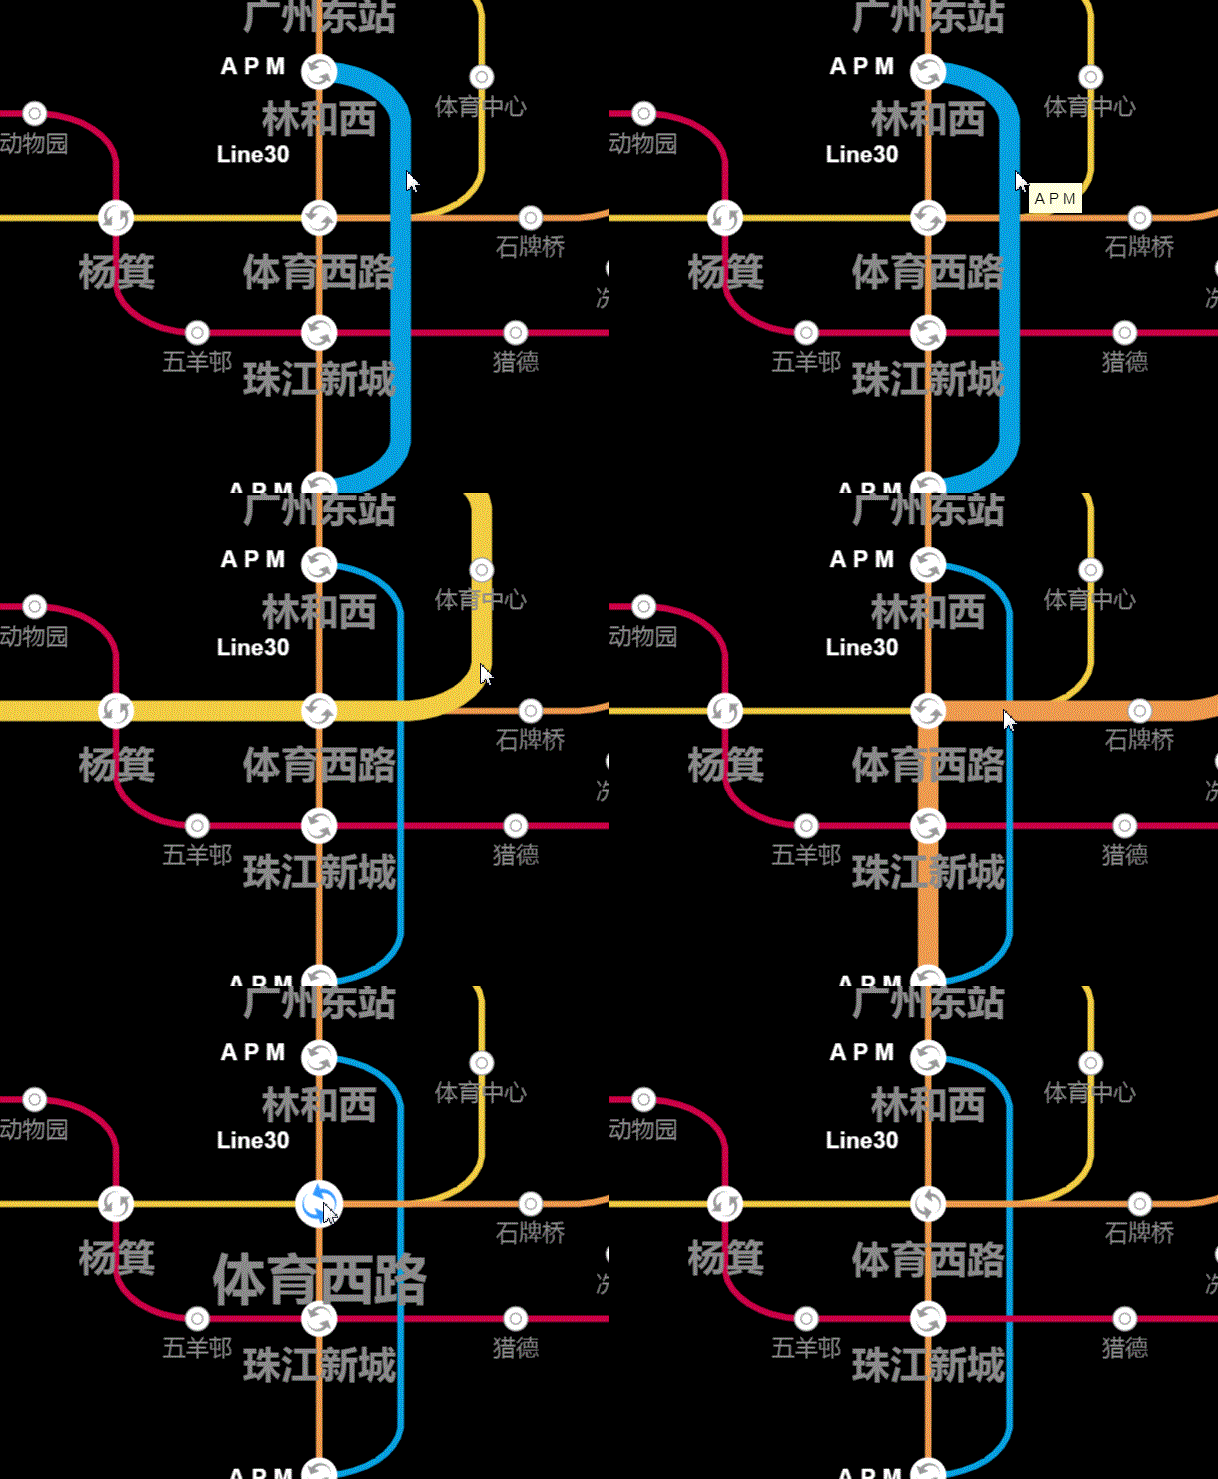
The first is the mouse movement event. When the mouse slides over a specific line, the line will become thicker, and you can see the number of this line after hovering for a while; when the mouse moves to "Change If you click "Site" or "Small Site", the icon corresponding to the site will become larger and change color, and the font will also become larger. When you move the mouse, the icon will return to its original color and the font will become smaller. The difference is that when the mouse moves to the "Transfer Station", the "Transfer Station" will rotate.

Mouse sliding event, I directly perform the mousemove event based on the underlying p of gv, pass in the event parameter through the getDataAt function encapsulated by ht, and obtain the corresponding node under the event. Then you can operate the nodes at will:
gv.getView().addEventListener('mousemove', function(e) {
    var data = gv.getDataAt(e);//传入逻辑坐标点或者交互event事件参数,返回当前点下的图元
    if(name) {
        originNode(name);//不管什么时候都要让节点保持原来的大小
    }

    if (data instanceof ht.Polyline) {//判断事件节点的类型
        dm.sm().ss(data);//选中“管道”
        name = '';
        clearInterval(interval);
    }
    else if (data instanceof ht.Node) {
        if(data.getTag() !== name && data.a('tpNode')) {//若不是同一个节点,并且mousemove的事件对象为ht.Node类型,那么设置节点的旋转
            interval = setInterval(function() {
                data.setRotation(data.getRotation() - Math.PI/16); //在自身旋转的基础上再旋转
            }, 100);
        }
        if(data.a('npNode')) {//如果鼠标移到“小站点”也要停止动画
            clearInterval(interval);
        }
        expandNode(data, name);////自定义的放大节点函数,比较容易,我不粘代码了,可以去http://hightopo.com/   查看
        dm.sm().ss(data);//设置选中节点
        name = data.getTag();//作为“上一个节点”的存储变量,可以通过这个值来获取节点
    }
    else {//其他任何情况则不选中任何内容并且清除“换乘站点”上的动画
        dm.sm().ss(null);
        name = '';
        clearInterval(interval);
    }
});When the mouse is hovering on the subway line, the "specific line information" is displayed. I do this by setting the tooltip (note: turn on the tooltip switch of gv):
gv.enableToolTip();//打开 tooltip 的开关
if(num === '68') polyline.setToolTip('A P M');//设置提示信息
else if(num === '60') polyline.setToolTip('G F');
else polyline.setToolTip('Line' + num);然后我利用右下角的 form 表单,单击表单上的具体线路,或者双击拓扑图上任意一个“站点”或者线路,则拓扑图会自适应到对应的部分,将被双击的部分展现到拓扑图的中央。

form 表单的声明部分我好像还没有解释。。。就是通过 new 一个 ht.widget.FomePane 类创建一个 form 表单组件,通过 form.getView() 获取表单组件的底层 p,将这个 p 摆放在 body 右下角,然后通过 addRow 函数向 form 表单中添加一行的表单项,可以在这行中添加任意多个项,通过 addRow 函数的第二个参数(一个数组),对添加进的表单项进行宽度的设置,通过第三个参数设置这行的高度:
function createForm() {//创建右下角的form表单
    var form = new ht.widget.FormPane();
    form.setWidth(200);//设置表单宽度
    form.setHeight(416);//设置表单高度
    let view = form.getView();
    document.body.appendChild(view);//将表单添加进body中
    view.style.zIndex = 1000;
    view.style.bottom = '10px';//ht组件几乎都设置绝对路径
    view.style.right = '10px';
    view.style.background = 'rgba(211, 211, 211, 0.8)';

    names.forEach(function(nameString) {
        form.addRow([//向表单中添加行
            {//这一行中的第一个表单项
                button: {//向表单中添加button按钮
                    icon: 'images/Line'+nameString.value+'.json',//设置按钮的图标
                    background: '',//设置按钮的背景
                    borderColor: '',//设置按钮的边框颜色
                    clickable: false//设置按钮不可点击
                }
            },
            {//第二个表单项
                button: {
                    label: nameString.name,
                    labelFont: 'bold 14px arial, sans-serif',
                    labelColor: '#fff',
                    background: '',
                    borderColor: '',
                    onClicked: function() {//按钮点击回调事件
                        gv.sm().ss(dm.getDataByTag(nameString.value));//设置选中按下的按钮对应的线路
                        gv.fitData(gv.sm().ld(), true, 5);//将选中的地铁线路显示在拓扑图的中央
                    }
                }
            }
        ], [0.1, 0.2], 23);//第二个参数是设置第一参数中的数组的宽度,小于1是比例,大于1是实际宽度。第三个参数是该行的高度
    });
}单击“站点”显示红色标注,双击节点自适应放置到拓扑图中央以及双击空白处将红色标注隐藏的内容都是通过对拓扑组件 gv 的事件监听来控制的,非常清晰易懂,代码如下:
var node = createRedLight();//创建一个新的节点,显示为“红灯”的样式
gv.mi(function(e) {//ht 中拓扑组件中的事件监听
    if(e.kind === 'clickData' && (e.data.a('tpNode') || e.data.a('npNode'))) {//e.kind获取当前事件类型,e.data获取当前事件下的节点
        node.s('2d.visible', true);//设置node节点可见
        node.setPosition(e.data.getPosition().x, e.data.getPosition().y);//设置node的坐标为当前事件下节点的位置
    }
    else if(e.kind === 'doubleClickData') {//双击节点
        gv.fitData(e.data, false, 10);//将事件下的节点自适应到拓扑图的中央,参数1为自适应的节点,参数2为是否动画,参数3为gv与边框的padding
    }
    else if(e.kind === 'doubleClickBackground') {//双击空白处
        node.s('2d.visible', false);//设置node节点不可见 查看 HT for Web 样式手册(http://www.hightopo.com/guide/guide/core/theme/ht-theme-guide.html#ref_style)
    }
});注意 s(style) 和 a(attr) 定义是这样的,s 是 ht 预定义的一些样式属性,而 a 是我们用户来自定义的属性,一般是通过调用字符串来调用结果的,这个字符串对应的可以是常量也可以是函数,还是很灵活的。
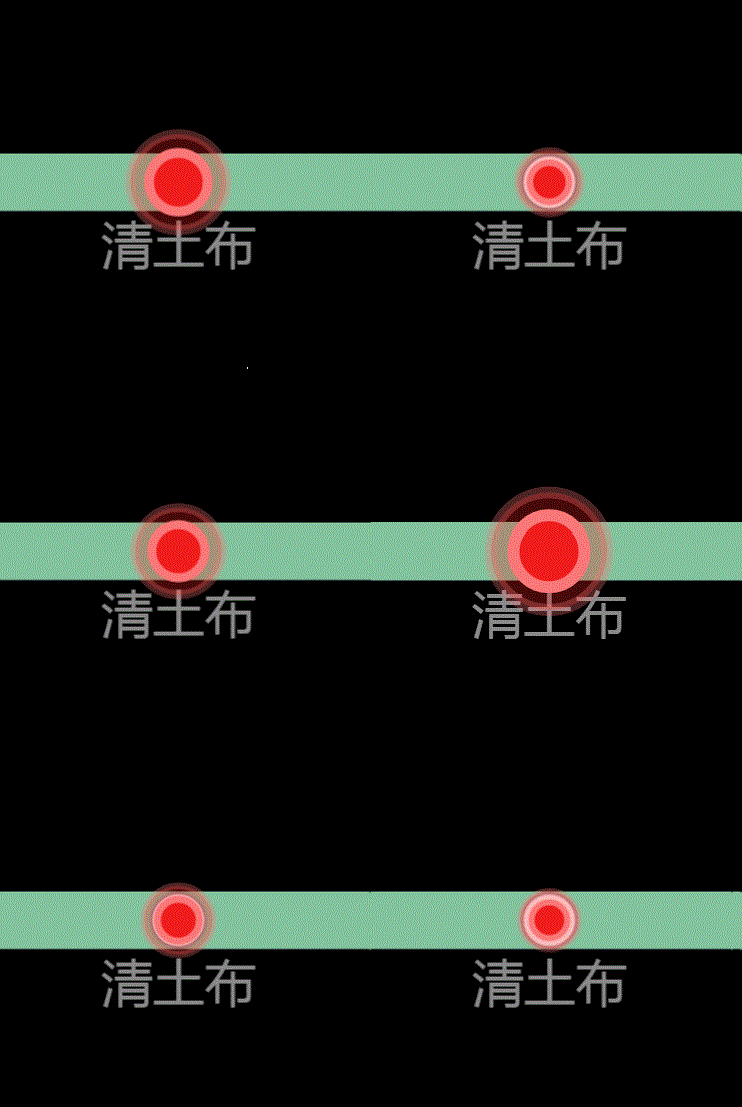
最后还做了一个小小的部分,选中“站点”,则该“站点”的上方会显示一个红色的会“呼吸”的用来注明当前选中的“站点”。

“呼吸”的部分是利用 ht 的 setAnimation 函数来完成的,在用这个函数之前要先打开数据容器的动画开关,然后设置动画:
dm.enableAnimation();//打开数据容器的动画开关
function createRedLight() {
    var node = new ht.Node();
    node.setImage('images/红灯.json');//设置节点的图片
    node.setSize(1, 1);//设置节点的大小
    node.setLayer('firstTop');//设置节点显示在gv的最上层
    node.s('2d.visible', false);//节点不可见
    node.s('select.width', 0);//节点选中时的边框为0,不可见
    node.s('2d.selectable', false);//设置这个属性,则节点不可选中

    node.setAnimation({//设置动画 具体参见 HT for Web 动画手册(http://www.hightopo.com/guide/guide/plugin/animation/ht-animation-guide.html)
        expandWidth: {
            property: "width",//设置这个属性,并且未设置 accessType,则默认通过 setWidth/getWidth 来设置和获取属性。这里的 width 和下面的 height 都是通过前面设置的 size 得到的
            from: 0.5, //动画开始时的属性值
            to: 1,//动画结束时的属性值
            next: "collapseWidth"//字符串类型,指定当前动画完成之后,要执行的下个动画,可将多个动画融合
        },
        collapseWidth: {
            property: "width",
            from: 1,
            to: 0.5,
            next: "expandWidth"
        },
        expandHeight: {
            property: "height",
            from: 0.5,
            to: 1,
            next: "collapseHeight"
        },
        collapseHeight: {
            property: "height",
            from: 1,
            to: 0.5,
            next: "expandHeight"
        },
        start: ["expandWidth", "expandHeight"]//数组,用于指定要启动的一个或多个动画
    });
    dm.add(node);
    return node;
}全部代码结束!
这个 Demo 花了我两天时间完成,总觉得有点不甘心啊,但是有时候思维又转不过弯来,花费了不少的时间,但是总的来说收获还是很多的,我以前一直以为只要通过 getPoints().push 来向多边形中添加点就可以了,求助了大神之后,发现原来这个方法不仅绕弯路而且还会出现各种各样的问题,比如 getPoints 之前,一定要在多边形中已经有 points 才可以,但是在很多情况下,初始化的 points 并不好设置,而且会造成代码很繁琐,直接通过 addPoint 方法,直接将点添加进多边形变量中,并且还会默认将点通过直线的方式连接,也不用设置 segments,多可爱的一个函数。
还有就是因为 ht 默认缩放大小是 20,而我这个 Demo 的间距又很小,导致缩放到最大地铁线路图显示也很小,所以我在 htconfig 中更改了 ht 的默认 zoomMax 属性,记住,更改这个值一定要在所有的 ht 调用之前,因为在 htconfig 中设置的值在后面定义都是不可更改的。
The above is the detailed content of HTML5 Canvas interactive subway map implementation code. For more information, please follow other related articles on the PHP Chinese website!
 What are the production methods of html5 animation production?
 The difference between HTML and HTML5
 How to get http status code in PHP
 Introduction to linux system classification
 How to solve the problem that Ethernet cannot connect to the internet
 What to do if postscript cannot be parsed
 How to view Tomcat source code
 How to buy Bitcoin
 What does vram mean?


