

D3.js creates logistics map
This time I will bring you D3.js to create a logistics map. What are the precautions for creating a logistics map with D3.js? The following is a practical case, let’s take a look.
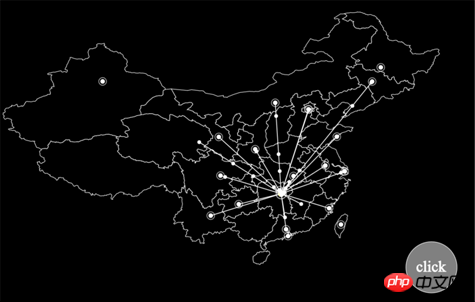
Example map
Production ideas
Need to draw a map of China, as background.
The latitude and longitude coordinates of major cities are required to draw the starting and ending points of road sheets.
The city that receives the logistics order draws a flashing mark.
The target city that already has a logistics order will no longer draw a route.
Every time a new logistics order is generated, there will be an animation effect of the mark moving along the route to the target.
The data after drawing needs to be cleaned up to reduce the resource usage of the browser.
Start coding
1. Create a web page template
Load D3JS for convenienceDebugging, directly download the d3.js file locally. When actually using it, you can change it to the loading path. Note that the V4 version of D3 is used, which is different from the V3 version.
Create a p block and prepare it for drawing.
<!DOCTYPE html>
<html lang="en">
  <head>
    <meta charset="utf8">
    <script type="text/javascript" src="../../static/d3/d3.js"></script>
    <title>地图</title>
  </head>
  <body>
    <p class="fxmap">
    </p>
  </body>
  <script type="text/javascript"></script>
</html>
Create SVG, all the following codes are placed in <script></script>
var width=1000 , height=800; // 定义SVG宽高
var svg = d3.select("body p.fxmap")
            .append("svg")
            .attr("width", "width)
            .attr("height", height)
.style("background","#000"); //Create SVG graphics grouping in preparation for calling
gmp, save the background map and starting point markers.
mline, saves the connection between the starting point and the target, as well as the target point.
button, button for testing
gmap = svg.append("g").attr("id", "map").attr("stroke", "white").attr("stroke-width",1);
    mline = svg.append("g").attr("id", "moveto").attr("stroke", "#FFF").attr("stroke-width", 1.5).attr("fill","#FFF");
button = svg.append("g").attr("id", "button").attr("stroke", "white").attr("stroke-width", 1).attr("fill", "white");Create projection function
Longitude and latitude cannot be used directly for drawing and need to be converted into plane coordinates. d3js provides a relatively rich range of projection methods. In this example, the geoEquirectangular() method is used.
projection is a method for converting longitude and latitude into plane coordinates
path is a method for converting longitude and latitude into line drawing point coordinates (save yourself Then write the function to construct the path path)
var projection = d3.geoEquirectangular()
              .center([465,395]) // 指定投影中心,注意[]中的是经纬度
              .scale(height)
              .translate([width / 2, height / 2]);
var path = d3.geoPath().projection(projection);
Create a marker so that multiple connection endpoints can be called
Because There will be multiple end points of the logistics line, so they are all called in a marker.
This mark is composed of a middle circle + an outer ring. The flashing effect of the outer ring is created separately.
marker = svg.append("defs")
          .append("marker")
          .append("marker")
          .attr("id", "pointer")
          .attr("viewBox","0 0 12 12")  // 可见范围
          .attr("markerWidth","12")    // 标记宽度
          .attr("markerHeight","12")    // 标记高度
          .attr("orient", "auto")     //
          .attr("markerUnits", "strokeWidth") // 随连接线宽度进行缩放
          .attr("refX", "6")       // 连接点坐标
          .attr("refY", "6")
    // 绘制标记中心圆
    marker.append("circle")
        .attr("cx", "6")
        .attr("cy", "6")
        .attr("r", "3")
        .attr("fill", "white");
    // 绘制标记外圆,之后在timer()中添加闪烁效果
    marker.append("circle")
        .attr("id", "markerC")
        .attr("cx", "6")
        .attr("cy", "6")
        .attr("r", "5")
        .attr("fill-opacity", "0")
        .attr("stroke-width", "1")
.attr("stroke", "white");Draw a map of China and mark the starting point (Changsha)
The longitude and latitude set used in the map is china.json. There are many files on the Internet
// 记录长沙坐标
    var changsha = projection([112.59,28.12]);
    // 读取地图数据,并绘制中国地图
    mapdata = [];
    d3.json('china.json', function(error, data){
      if (error)
        console.log(error);
      // 读取地图数据
      mapdata = data.features;
      // 绘制地图
      gmap.selectAll("path")
        .data(mapdata)
        .enter()
        .append("path")
        .attr("d", path);
      // 标记长沙
      gmap.append("circle").attr("id","changsha")
        .attr("cx", changsha[0])
        .attr("cy", changsha[1])
        .attr("r", "6")
        .attr("fill", "yellow")
      gmap.append("circle").attr("id","changshaC")
        .attr("cx", changsha[0])
        .attr("cy", changsha[1])
        .attr("r", "10")
        .attr("stroke-width", "2")
        .attr("fill-opacity", "0");
});Create a method to draw a line from the specified starting point to the end point, and draw markers at the network points.
The method requires inputting the destination city name (city) and latitude and longitude (data)
Call the previously established project() method. Convert the end point latitude and longitude into plane coordinates.
Calculate the distance between the starting point (Changsha) and the end point as line length and animation time parameters.
Draw a circular mark on the line and animate the movement from the starting point to the end point.
After the mark is moved to the end point, it will be deleted to save resources.
If the line point has been drawn before, no line will be drawn, only the moving mark will be drawn.
Every time a logistics order is processed, the city record will be +1.
// 创建对象,保存每个城市的物流记录数量
    var citylist = new Object();
    // 创建方法,输入data坐标,绘制发射线
    var moveto = function(city, data){
      var pf = {x:projection([112.59,28.12])[0], y:projection([112.59,28.12])[1]};
      var pt = {x:projection(data)[0], y:projection(data)[1]};
      var distance = Math.sqrt((pt.x - pf.x)**2 + (pt.y - pf.y)**2);
      if (city in citylist){
        citylist[city]++;
      }else{
        mline.append("line")
            .attr("x1", pf.x)
            .attr("y1", pf.y)
            .attr("x2", pt.x)
            .attr("y2", pt.y)
            .attr("marker-end","url(#pointer)")
            .style("stroke-dasharray", " "+distance+", "+distance+" ")
            .transition()
            .duration(distance*30)
            .styleTween("stroke-dashoffset", function(){
              return d3.interpolateNumber(distance, 0);
            });
        citylist[city] = 1;
      };
      mline.append("circle")
        .attr("cx", pf.x)
        .attr("cy", pf.y)
        .attr("r", 3)
        .transition()
        .duration(distance*30)
        .attr("transform", "translate("+(pt.x-pf.x)+","+(pt.y-pf.y)+")")
        .remove();
};Create an animation queue example to achieve the flashing effect of the outer circle of the mark
var scale = d3.scaleLinear();
    scale.domain([0, 1000, 2000])
      .range([0, 1, 0]);
    var start = Date.now();
    d3.timer(function(){
      var s1 = scale((Date.now() - start)%2000);
      // console.log(s1);
      gmap.select("circle#changshaC")
        .attr("stroke-opacity", s1);
      marker.select("circle#markerC")
        .attr("stroke-opacity", s1);
});Create a test button and test target city data
var cityordinate = {
      '哈尔滨':[126.5416150000,45.8088260000],
      '石家庄':[116.46,39.92],
      '北京':[116.39564503787867,39.92998577808024],
      '上海':[121.480539,31.235929],
      '广州':[113.271431,23.135336],
      '重庆':[106.558434,29.568996],
      '青岛':[120.38442818368189,36.10521490127382],
      '福州':[119.30347,26.080429],
      '兰州':[103.840521,36.067235],
      '贵阳':[106.636577,26.653325],
      '成都':[104.081534,30.655822],
      '西安':[108.946466,34.347269],
      '长春':[125.3306020000,43.8219540000],
      '台湾':[120.961454,23.80406],
      '呼和浩特':[111.7555090000,40.8484230000],
      '澳门':[113.5494640000,22.1929190000],
      '武汉':[114.3115820000,30.5984670000],
      '昆明':[102.71460113878045,25.049153100453159],
      '乌鲁木齐':[87.56498774111579,43.84038034721766],
      '益阳':[112.36654664522563,28.58808777988717],
      '南京':[118.77807440802562,32.05723550180587],
      '武昌':[114.35362228468498,30.56486029278519],
    };
    // 随机获得目标城市
    var cityname = [], total = 0;
    for (var key in cityordinate){
      cityname[total++] = key;
    };

    // 创建操作按钮,每次点击发射一条物流线
    button.append("circle")
        .attr("cx", width*0.9)
        .attr("cy", height*0.8)
        .attr("r", width/20)
        .attr("text","click")
        .attr("fill", "grey");
    button.append("text")
        .attr("x", width*0.87)
        .attr("y", height*0.81)
        .style("font-size", "30px")
        .text("click");
    button.on("click", function(){
      var _index = ~~(Math.random() * total);
      moveto(cityname[_index], cityordinate[cityname[_index]]);
});Believe it or not After reading the case in this article, you have mastered the method. For more exciting information, please pay attention to other related articles on the PHP Chinese website!
Recommended reading:
JS method for obtaining the top N color values of an image
Detailed explanation of graphics and text using the render method
The applet uses .getImageInfo() to obtain image information
The above is the detailed content of D3.js creates logistics map. For more information, please follow other related articles on the PHP Chinese website!

Hot AI Tools

Undresser.AI Undress
AI-powered app for creating realistic nude photos

AI Clothes Remover
Online AI tool for removing clothes from photos.

Undress AI Tool
Undress images for free

Clothoff.io
AI clothes remover

AI Hentai Generator
Generate AI Hentai for free.

Hot Article
Hot Tools

Notepad++7.3.1
Easy-to-use and free code editor

SublimeText3 Chinese version
Chinese version, very easy to use

Zend Studio 13.0.1
Powerful PHP integrated development environment

Dreamweaver CS6
Visual web development tools

SublimeText3 Mac version
God-level code editing software (SublimeText3)
Hot Topics
 1376
1376
 52
52

 How to make Google Maps the default map in iPhone
Apr 17, 2024 pm 07:34 PM
How to make Google Maps the default map in iPhone
Apr 17, 2024 pm 07:34 PM
The default map on the iPhone is Maps, Apple's proprietary geolocation provider. Although the map is getting better, it doesn't work well outside the United States. It has nothing to offer compared to Google Maps. In this article, we discuss the feasible steps to use Google Maps to become the default map on your iPhone. How to Make Google Maps the Default Map in iPhone Setting Google Maps as the default map app on your phone is easier than you think. Follow the steps below – Prerequisite steps – You must have Gmail installed on your phone. Step 1 – Open the AppStore. Step 2 – Search for “Gmail”. Step 3 – Click next to Gmail app
 How to implement an online speech recognition system using WebSocket and JavaScript
Dec 17, 2023 pm 02:54 PM
How to implement an online speech recognition system using WebSocket and JavaScript
Dec 17, 2023 pm 02:54 PM
How to use WebSocket and JavaScript to implement an online speech recognition system Introduction: With the continuous development of technology, speech recognition technology has become an important part of the field of artificial intelligence. The online speech recognition system based on WebSocket and JavaScript has the characteristics of low latency, real-time and cross-platform, and has become a widely used solution. This article will introduce how to use WebSocket and JavaScript to implement an online speech recognition system.
 WebSocket and JavaScript: key technologies for implementing real-time monitoring systems
Dec 17, 2023 pm 05:30 PM
WebSocket and JavaScript: key technologies for implementing real-time monitoring systems
Dec 17, 2023 pm 05:30 PM
WebSocket and JavaScript: Key technologies for realizing real-time monitoring systems Introduction: With the rapid development of Internet technology, real-time monitoring systems have been widely used in various fields. One of the key technologies to achieve real-time monitoring is the combination of WebSocket and JavaScript. This article will introduce the application of WebSocket and JavaScript in real-time monitoring systems, give code examples, and explain their implementation principles in detail. 1. WebSocket technology
 How to use JavaScript and WebSocket to implement a real-time online ordering system
Dec 17, 2023 pm 12:09 PM
How to use JavaScript and WebSocket to implement a real-time online ordering system
Dec 17, 2023 pm 12:09 PM
Introduction to how to use JavaScript and WebSocket to implement a real-time online ordering system: With the popularity of the Internet and the advancement of technology, more and more restaurants have begun to provide online ordering services. In order to implement a real-time online ordering system, we can use JavaScript and WebSocket technology. WebSocket is a full-duplex communication protocol based on the TCP protocol, which can realize real-time two-way communication between the client and the server. In the real-time online ordering system, when the user selects dishes and places an order
 How to implement an online reservation system using WebSocket and JavaScript
Dec 17, 2023 am 09:39 AM
How to implement an online reservation system using WebSocket and JavaScript
Dec 17, 2023 am 09:39 AM
How to use WebSocket and JavaScript to implement an online reservation system. In today's digital era, more and more businesses and services need to provide online reservation functions. It is crucial to implement an efficient and real-time online reservation system. This article will introduce how to use WebSocket and JavaScript to implement an online reservation system, and provide specific code examples. 1. What is WebSocket? WebSocket is a full-duplex method on a single TCP connection.
 How to add store address to Xiaohongshu map? How to fill in the store address setting?
Mar 29, 2024 am 09:41 AM
How to add store address to Xiaohongshu map? How to fill in the store address setting?
Mar 29, 2024 am 09:41 AM
As Xiaohongshu becomes more and more popular among young people, more and more people choose to open stores on Xiaohongshu. Many novice sellers encounter difficulties when setting up their store address and do not know how to add the store address to the map. 1. How to add the store address to the map in Xiaohongshu? 1. First, make sure your store has a registered account on Xiaohongshu and has successfully opened a store. 2. Log in to your Xiaohongshu account, enter the store backend, and find the "Store Settings" option. 3. On the store settings page, find the "Store Address" column and click "Add Address". 4. In the address adding page that pops up, fill in the detailed address information of the store, including province, city, district, county, street, house number, etc. 5. After filling in, click the "Confirm Add" button. Xiaohongshu will provide you with the address
 JavaScript and WebSocket: Building an efficient real-time weather forecasting system
Dec 17, 2023 pm 05:13 PM
JavaScript and WebSocket: Building an efficient real-time weather forecasting system
Dec 17, 2023 pm 05:13 PM
JavaScript and WebSocket: Building an efficient real-time weather forecast system Introduction: Today, the accuracy of weather forecasts is of great significance to daily life and decision-making. As technology develops, we can provide more accurate and reliable weather forecasts by obtaining weather data in real time. In this article, we will learn how to use JavaScript and WebSocket technology to build an efficient real-time weather forecast system. This article will demonstrate the implementation process through specific code examples. We
 How to use at-a-glance directions on Google Maps
Jun 13, 2024 pm 09:40 PM
How to use at-a-glance directions on Google Maps
Jun 13, 2024 pm 09:40 PM
A year after its launch, Google Maps has launched a new feature. Once you set a route to your destination on the map, it summarizes your travel route. Once your journey begins, you can "Browse" route guidance from your phone's lock screen. You can use Google Maps to see your estimated arrival time and route. Throughout your trip, you can view navigation information on your lock screen, and by unlocking your phone, you can view navigation information without accessing Google Maps. By unlocking your phone, you can view navigation information without accessing Google Maps. By unlocking your phone, you can view navigation information without accessing Google Maps. By unlocking your phone, you can view navigation information without accessing Google Maps. By unlocking your phone, you can view navigation information without accessing Google Maps. By unlocking your phone, you can view navigation information without accessing Google Maps.
