

Canvas implements wave progress chart (with demo)
This time I will bring you the Canvas implementation of the wave progress chart (with demo). What are the precautions for the Canvas implementation of the wave progress chart. The following is a practical case, let's take a look.
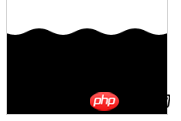
This article introduces the HTML5 Canvas to play with the cool big wave progress chart effect, the details are as follows:

As you can see in the picture above, this article is to achieve the above kind of effect.
Because AlloyTouch recently needs to write a cool loading effect with pull-down refresh. Therefore, the large wave progress chart is preferred.
First of all, we need to encapsulate the big wave picture progress component. The basic principle is to use Canvas to draw vector graphics and picture materials to synthesize wave effects.
Understanding quadraticCurveTo
The quadraticCurveTo() method adds a point to the current path by using a specified control point that represents a quadratic Bezier curve.
JavaScript Syntax:
context.quadraticCurveTo(cpx,cpy,x,y);
Parameter value
cpx x coordinate of the Bezier control point
cpy The y coordinate of the Bezier control point
x The x coordinate of the end point
y The y coordinate of the end point
Such as:
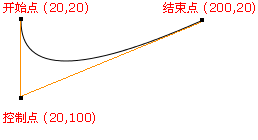
ctx.moveTo(20,20);
ctx.quadraticCurveTo(20,100,200,20);
ctx.stroke();
Passed The above code can draw a quadratic Bezier curve. The specific principle and effect are shown in the figure below:
Try to draw waves
var waveWidth = 300,
    offset = 0,
    waveHeight = 8,
    waveCount = 5,
    startX = -100,
    startY = 208,
    progress = 0,
    progressStep = 1,
    d2 = waveWidth / waveCount,
    d = d2 / 2,
    hd = d / 2,
    c = document.getElementById("myCanvas"),
    ctx = c.getContext("2d");
function tick() {
    offset -= 5;
    progress += progressStep;
    if (progress > 220 || progress < 0) progressStep *= -1;
    if (-1 * offset === d2) offset = 0;
    ctx.clearRect(0, 0, c.width, c.height);
    ctx.beginPath();
    var offsetY = startY - progress;
    ctx.moveTo(startX - offset, offsetY);
    for (var i = 0; i < waveCount; i++) {
        var dx = i * d2;
        var offsetX = dx + startX - offset;
        ctx.quadraticCurveTo(offsetX + hd, offsetY + waveHeight, offsetX + d, offsetY);
        ctx.quadraticCurveTo(offsetX + hd + d, offsetY - waveHeight, offsetX + d2, offsetY);
    }
    ctx.lineTo(startX + waveWidth, 300);
    ctx.lineTo(startX, 300);
    ctx.fill();
    requestAnimationFrame(tick);
}
tick();You can see the waves with infinite motion:
What is needed here is that the drawing area is larger than the Canvas to hide the swing correction image. The Canvas of 200200 is used above.
You can clone the code and try to draw it on a large Canvas to understand.
Here, an infinite loop is achieved through if (-1 offset === d2) offset = 0;.
d2 is the length of a wave crest + wave trough. After a wave peak + a wave trough, the same life cycle is the same as starting from 0, so it can be reset to 0.
Understand globalCompositeOperation
globalCompositeOperation PropertiesDescribes how the colors drawn to the canvas are combined with colors already on the canvas.
To draw a big wave progress chart, you will use:
ctx.globalCompositeOperation = "destination-atop";
destination-atop Meaning: The existing content on the canvas will only be retained where it overlaps with the new graphic. The new shape is drawn after the content.
Of course, globalCompositeOperation has many options, which are not listed here. You can try setting other properties to adjust cool overlay effects.
Overall implementation
var img = new Image();
function tick() {
    ...
    ...
    ctx.fill();
    ctx.globalCompositeOperation = "destination-atop";
    ctx.drawImage(img, 0, 0);
    requestAnimationFrame(tick);
}
img.onload = function () {
    tick();
};
img.src = "asset/alloy.png";In order to make the code simple and direct, there is no need to encapsulate the code of a loader, and directly set the src through new Image to load the image.
After drawing the vector image, set the globalCompositeOperation, and then draw the penguin image. The drawing order cannot be mistaken.
Finally
Example download: demo
I believe you have mastered the method after reading the case in this article. For more exciting information, please pay attention to other related articles on the php Chinese website!
Recommended reading:
Detailed explanation of the use of paging queries
The relationship between characters and mathematical functions
The above is the detailed content of Canvas implements wave progress chart (with demo). For more information, please follow other related articles on the PHP Chinese website!

Hot AI Tools

Undresser.AI Undress
AI-powered app for creating realistic nude photos

AI Clothes Remover
Online AI tool for removing clothes from photos.

Undress AI Tool
Undress images for free

Clothoff.io
AI clothes remover

Video Face Swap
Swap faces in any video effortlessly with our completely free AI face swap tool!

Hot Article
Hot Tools

Notepad++7.3.1
Easy-to-use and free code editor

SublimeText3 Chinese version
Chinese version, very easy to use

Zend Studio 13.0.1
Powerful PHP integrated development environment

Dreamweaver CS6
Visual web development tools

SublimeText3 Mac version
God-level code editing software (SublimeText3)
Hot Topics
 1386
1386
 52
52

 What does demo mean?
Feb 12, 2024 pm 09:12 PM
What does demo mean?
Feb 12, 2024 pm 09:12 PM
The word demo is no longer unfamiliar to friends who like to sing, but many users who have never been exposed to it are curious about what demo means. Now let’s take a look at the meaning of the demo brought by the editor. What does demo mean? Answer: Demo tape. 1. The pronunciation of demo is ['deməʊ] in English and ['demoʊ] in America. 2. Demo is the abbreviation of "demonstration", which generally refers to the preliminary effect of listening to a song before it is officially recorded. 3. Demo is used as a noun to refer to sample tapes and sample records. The meaning of verb is trial (especially software), demonstration and demonstration;
 What are the canvas arrow plug-ins?
Aug 21, 2023 pm 02:14 PM
What are the canvas arrow plug-ins?
Aug 21, 2023 pm 02:14 PM
The canvas arrow plug-ins include: 1. Fabric.js, which has a simple and easy-to-use API and can create custom arrow effects; 2. Konva.js, which provides the function of drawing arrows and can create various arrow styles; 3. Pixi.js , which provides rich graphics processing functions and can achieve various arrow effects; 4. Two.js, which can easily create and control arrow styles and animations; 5. Arrow.js, which can create various arrow effects; 6. Rough .js, you can create hand-drawn arrows, etc.
 What are the details of the canvas clock?
Aug 21, 2023 pm 05:07 PM
What are the details of the canvas clock?
Aug 21, 2023 pm 05:07 PM
The details of the canvas clock include clock appearance, tick marks, digital clock, hour, minute and second hands, center point, animation effects, other styles, etc. Detailed introduction: 1. Clock appearance, you can use Canvas to draw a circular dial as the appearance of the clock, and you can set the size, color, border and other styles of the dial; 2. Scale lines, draw scale lines on the dial to represent hours or minutes. Position; 3. Digital clock, you can draw a digital clock on the dial to indicate the current hour and minute; 4. Hour hand, minute hand, second hand, etc.
 What versions of html2canvas are there?
Aug 22, 2023 pm 05:58 PM
What versions of html2canvas are there?
Aug 22, 2023 pm 05:58 PM
The versions of html2canvas include html2canvas v0.x, html2canvas v1.x, etc. Detailed introduction: 1. html2canvas v0.x, which is an early version of html2canvas. The latest stable version is v0.5.0-alpha1. It is a mature version that has been widely used and verified in many projects; 2. html2canvas v1.x, this is a new version of html2canvas.
 Learn the canvas framework and explain the commonly used canvas framework in detail
Jan 17, 2024 am 11:03 AM
Learn the canvas framework and explain the commonly used canvas framework in detail
Jan 17, 2024 am 11:03 AM
Explore the Canvas framework: To understand what are the commonly used Canvas frameworks, specific code examples are required. Introduction: Canvas is a drawing API provided in HTML5, through which we can achieve rich graphics and animation effects. In order to improve the efficiency and convenience of drawing, many developers have developed different Canvas frameworks. This article will introduce some commonly used Canvas frameworks and provide specific code examples to help readers gain a deeper understanding of how to use these frameworks. 1. EaselJS framework Ea
 uniapp implements how to use canvas to draw charts and animation effects
Oct 18, 2023 am 10:42 AM
uniapp implements how to use canvas to draw charts and animation effects
Oct 18, 2023 am 10:42 AM
How to use canvas to draw charts and animation effects in uniapp requires specific code examples 1. Introduction With the popularity of mobile devices, more and more applications need to display various charts and animation effects on the mobile terminal. As a cross-platform development framework based on Vue.js, uniapp provides the ability to use canvas to draw charts and animation effects. This article will introduce how uniapp uses canvas to achieve chart and animation effects, and give specific code examples. 2. canvas
 What properties does tkinter canvas have?
Aug 21, 2023 pm 05:46 PM
What properties does tkinter canvas have?
Aug 21, 2023 pm 05:46 PM
The tkinter canvas attributes include bg, bd, relief, width, height, cursor, highlightbackground, highlightcolor, highlightthickness, insertbackground, insertwidth, selectbackground, selectforeground, xscrollcommand attributes, etc. Detailed introduction
 Explore the powerful role and application of canvas in game development
Jan 17, 2024 am 11:00 AM
Explore the powerful role and application of canvas in game development
Jan 17, 2024 am 11:00 AM
Understand the power and application of canvas in game development Overview: With the rapid development of Internet technology, web games are becoming more and more popular among players. As an important part of web game development, canvas technology has gradually emerged in game development, showing its powerful power and application. This article will introduce the potential of canvas in game development and demonstrate its application through specific code examples. 1. Introduction to canvas technology Canvas is a new element in HTML5, which allows us to use
