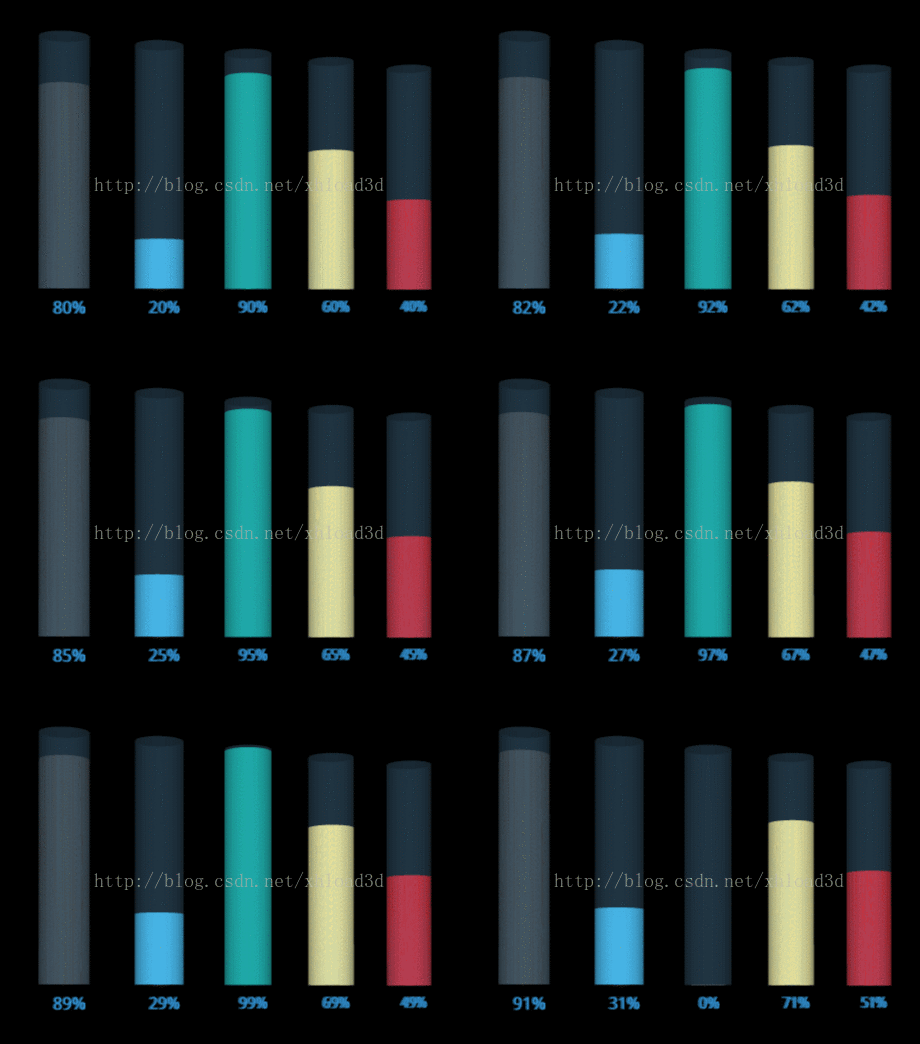
This time I will bring you CanvasHow to make a 3D dynamic Chart chart, Canvas makes a 3D dynamic Chart chartWhat are the precautions, the following is a practical case, one Get up and take a look.
I found that there are a lot of charts used in industrial SCADA or telecommunications network management. Although most people use echarts for chart production, it is indeed easy to use, but sometimes we cannot call other plug-ins. At this time, you have to write these beautiful charts yourself, but charts cannot be made beautiful easily. . . I saw a chart for sale on a website and thought it looked pretty good, so I used HT for Web 3D to make a small example. It’s quite simple and pretty, haha~
The dynamic rendering is as follows:

This example is really easy to implement with HT. First create a basic dm data model in HT, then add the data model to the g3d 3d component, and then set it Perspective in 3D and add the 3D component to the body element:
dm = new ht.DataModel();
g3d = new ht.graph3d.Graph3dView(dm);
g3d.setEye(0, 185, 300);
g3d.addToDOM();
g3d.getView().style.background = '#000';
The next step is to create these five chart bars. My idea is this, there is a node in the inner layer and a transparent one in the outer layer Node, a 3D text at the bottom shows the current percentage.
The inner node is very easy. I directly use the ht.Node encapsulated by HT to create a new node object, and then set the style of the node node through the node.s method:
var node = new ht.Node();
node.s({
    'shape3d': cylinderModel,
    'shape3d.color': color,
    '3d.movable': false
});
node.a({
    'myHeight': s3[1],
});
node.p3([p3[0], s3[1]/2, p3[2]]);
node.s3(s3);
dm.add(node);What needs to be explained is that the setting of the 'shape3d':cylinderModel style, first of all, shape3d propertiesspecifies the icon effect displayed as a 3D model. cylinderModel is a 3D model customized with HT. Please refer to HT for Web Modeling Manual:
cylinderModel = ht.Default.createCylinderModel(1000, 0, 1000, false, false, true, true);
Then set a dynamically changing attribute myHeight. In HT, the node.a method is reserved for users to store business data. We can add as many as we want here. Attributes.
The next thing we want to create is an external transparent node. The construction method of this node is basically the same as the internal node, but with a little more "transparent" style setting:
var cNode = new ht.Node();
cNode.s({
    'shape3d': cylinderModel,
    'shape3d.transparent': true,
    'shape3d.opacity': 0.2,
    'label.color': '#fff',
    '3d.movable': false
});
cNode.p3([p3[0], 50, p3[2]]);
cNode.s3(20, 100, 20);
dm.add(cNode);To first Set 'shape3d.transparent' to true, and then set 'shape3d.opacity' transparency.
The last is 3D text. To render 3D text, you need a typeface font in json format, and then use ht.Default.loadFontFace to load the json format font into the memory. For details, please refer to the HT for Web 3D manual:
ht.Default.loadFontFace('./wenquanyi.json', function(){
    //......
    var text = new ht.Node();
    text.s3([5, 5, 5]);
    text.p3(cNode.p3()[0]-5, -10, 0);
    dm.add(text);
    text.s({
        'shape3d' : 'text',
    'shape3d.text': node.a('myHeight')+'%',
    'shape3d.text.curveSegments': 1,
    '3d.movable': false
    });
});Because the typeface font we use draws one word composed of countless triangles, which takes up a lot of memory, so I adjusted the fineness of the curve of the graphic to a lower level, but it is still very clear. If If you can find a font with better performance, you can use it and let me know. We have not found a font that takes up less memory.
Finally, to dynamically change the column chart in the chart, we have to set animation and update the 3D font value simultaneously:
setInterval(function(){
    if(node.a('myHeight') < 100){
        node.a('myHeight', (node.getAttr('myHeight')+1));
    node.s3(20, node.a('myHeight'), 20);
    node.p3(p3[0], node.a('myHeight')/2, p3[2]);
    }else{
        node.a('myHeight', 0);
    node.s3([20, 0, 20]);
    node.p3([p3[0], 0, p3[2]]);
    }
    if (text) text.s('shape3d.text', node.a('myHeight')+'%');
}, 100);Here, my custom attribute "myHeight" ” plays a decisive role. I use this attribute to store variables, and I can change the value of the variable at will, so that the effect of dynamic binding can be achieved.
If you still don’t understand, you can leave a message, or go directly to our official website to view the manual HT for Web. There are more effects you can’t think of that can be quickly realized~
I believe you will read the case in this article You have mastered the method. For more exciting information, please pay attention to other related articles on the php Chinese website!
Recommended reading:
H5 method of reading files and uploading to the server
How to add the right side of the select drop-down box Prompt icon
The above is the detailed content of How to create a 3D dynamic Chart in Canvas. For more information, please follow other related articles on the PHP Chinese website!
 What are the methods to change IP in dynamic vps instantly?
 What are the production methods of html5 animation production?
 How to register on Matcha Exchange
 How to implement color fonts in css
 Ripple currency today's market price
 Configuration of python environment variables
 cloud computing technology
 How to solve invalid synrax


