

H5 canvas chart implements bar chart
This time I will bring you H5 canvas chart to implement histogram. What are the precautions for implementing histogram in canvas chart? The following is a practical case, let's take a look.
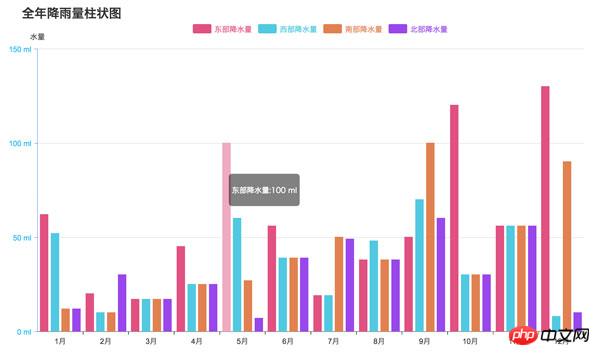
I used a chart library a few days ago, among which Baidu's ECharts seems to be the best. It uses canvas by default. Canvas charts are better than svg in processing big data. Then I will also use canvas to implement a chart library. It doesn’t feel too difficult. Let’s implement a simple bar chart first.The effect is as follows:
- Text drawing
- XY axis drawing;
- Data group drawing;
- Implementation of data animation;
- Handling of mouse events.
First let’s take a look at how to use it. Referring to some of the usage methods of ECharts, first pass in the ## to display the chart. #html tag
, then call init and pass in data during initialization.var con=document.getElementById('container');
var chart=new Bar(con);
chart.init({
title:'全年降雨量柱状图',
xAxis:{// x轴
data:['1月','2月','3月','4月','5月','6月','7月','8月','9月','10月','11月','12月']
},
yAxis:{//y轴
name:'水量',
formatter:'{value} ml'
},
series:[//分组数据
{
name:'东部降水量',
data:[62,20,17,45,100,56,19,38,50,120,56,130]
},
{
name:'西部降水量',
data:[52,10,17,25,60,39,19,48,70,30,56,8]
},
{
name:'南部降水量',
data:[12,10,17,25,27,39,50,38,100,30,56,90]
},
{
color:'hsla(270,80%,60%,1)',
name:'北部降水量',
data:[12,30,17,25,7,39,49,38,60,30,56,10]
}
]
});class Chart{
constructor(container){
this.container=container;
this.canvas=document.createElement('canvas');
this.ctx=this.canvas.getContext('2d');
this.W=1000*2;
this.H=600*2;
this.padding=120;
this.paddingTop=50;
this.title='';
this.legend=[];
this.series=[];
//通过缩小一倍,解决字体模糊问题
this.canvas.width=this.W;
this.canvas.height=this.H;
this.canvas.style.width = this.W/2 + 'px';
this.canvas.style.height = this.H/2 + 'px';
}
}class Bar extends Chart{
constructor(container){
super(container);
this.xAxis={};
this.yAxis=[];
this.animateArr=[];
}
init(opt){
Object.assign(this,opt);
if(!this.container)return;
this.container.style.position='relative';
this.tip=document.createElement('p');
this.tip.style.cssText='display: none; position: absolute; opacity: 0.5; background: #000; color: #fff; border-radius: 5px; padding: 5px; font-size: 8px; z-index: 99;';
this.container.appendChild(this.canvas);
this.container.appendChild(this.tip);
this.draw();
this.bindEvent();
}
draw(){//绘制
}
showInfo(){//显示信息
}
animate(){//执行动画
}
showData(){//显示数据
}- The measureText method is used to draw text, which can be used to measure the width of the text, so that the position of the next drawing can be adjusted to avoid position conflicts.
- translate displacement method can be placed in the drawing context (between save and restore), which can avoid complex position calculations.
-
draw(){ var that=this, ctx=this.ctx, canvas=this.canvas, W=this.W, H=this.H, padding=this.padding, paddingTop=this.paddingTop, xl=0,xs=0,xdis=W-padding*2,//x轴单位数,每个单位长度,x轴总长度 yl=0,ys=0,ydis=H-padding*2-paddingTop;//y轴单位数,每个单位长度,y轴总长度 ctx.fillStyle='hsla(0,0%,20%,1)'; ctx.strokeStyle='hsla(0,0%,10%,1)'; ctx.lineWidth=1; ctx.textAlign='center'; ctx.textBaseLine='middle'; ctx.font='24px arial'; ctx.clearRect(0,0,W,H); if(this.title){ ctx.save(); ctx.textAlign='left'; ctx.font='bold 40px arial'; ctx.fillText(this.title,padding-50,70); ctx.restore(); } if(this.yAxis&&this.yAxis.name){ ctx.fillText(this.yAxis.name,padding,padding+paddingTop-30); } // x轴 ctx.save(); ctx.beginPath(); ctx.translate(padding,H-padding); ctx.moveTo(0,0); ctx.lineTo(W-2*padding,0); ctx.stroke(); // x轴刻度 if(this.xAxis&&(xl=this.xAxis.data.length)){ xs=(W-2*padding)/xl; this.xAxis.data.forEach((obj,i)=>{ var x=xs*(i+1); ctx.moveTo(x,0); ctx.lineTo(x,10); ctx.stroke(); ctx.fillText(obj,x-xs/2,40); }); } ctx.restore(); // y轴 ctx.save(); ctx.beginPath(); ctx.strokeStyle='hsl(220,100%,50%)'; ctx.translate(padding,H-padding); ctx.moveTo(0,0); ctx.lineTo(0,2*padding+paddingTop-H); ctx.stroke(); ctx.restore(); if(this.series.length){ var curr,txt,dim,info,item,tw=0; for(var i=0;i<this.series.length;i++){ item=this.series[i]; if(!item.data||!item.data.length){ this.series.splice(i--,1);continue; } // 赋予没有颜色的项 if(!item.color){ var hsl=i%2?180+20*i/2:20*(i-1); item.color='hsla('+hsl+',70%,60%,1)'; } item.name=item.name||'unnamed'; // 画分组标签 ctx.save(); ctx.translate(padding+W/4,paddingTop+40); that.legend.push({ hide:item.hide||false, name:item.name, color:item.color, x:padding+that.W/4+i*90+tw, y:paddingTop+40, w:60, h:30, r:5 }); ctx.textAlign='left'; ctx.fillStyle=item.color; ctx.strokeStyle=item.color; roundRect(ctx,i*90+tw,0,60,30,5); ctx.globalAlpha=item.hide?0.3:1; ctx.fill(); ctx.fillText(item.name,i*90+tw+70,26); tw+=ctx.measureText(item.name).width;//计算字符长度 ctx.restore(); if(item.hide)continue; //计算数据在Y轴刻度 if(!info){ info=calculateY(item.data.slice(0,xl)); } curr=calculateY(item.data.slice(0,xl)); if(curr.max>info.max){ info=curr; } } if(!info) return; yl=info.num; ys=ydis/yl; //画Y轴刻度 ctx.save(); ctx.fillStyle='hsl(200,100%,60%)'; ctx.translate(padding,H-padding); for(var i=0;i<=yl;i++){ ctx.beginPath(); ctx.strokeStyle='hsl(220,100%,50%)'; ctx.moveTo(-10,-Math.floor(ys*i)); ctx.lineTo(0,-Math.floor(ys*i)); ctx.stroke(); ctx.beginPath(); ctx.strokeStyle='hsla(0,0%,80%,1)'; ctx.moveTo(0,-Math.floor(ys*i)); ctx.lineTo(xdis,-Math.floor(ys*i)); ctx.stroke(); ctx.textAlign='right'; dim=Math.min(Math.floor(info.step*i),info.max); txt=this.yAxis.formatter?this.yAxis.formatter.replace('{value}',dim):dim; ctx.fillText(txt,-20,-ys*i+10); } ctx.restore(); //画数据 this.showData(xl,xs,info.max); } }Copy after loginDrawing data
Because the data item needs to perform subsequent animations and display content when the mouse slides over, it is put into the animation queue. animateArr. Here we need to expand the grouped data, convert the previous two nested arrays into one layer, and calculate the attributes of each data item, such as name, x coordinate, y coordinate, width, speed, and color. After the data is organized, the animation is executed.
showData(xl,xs,max){
    //画数据
    var that=this,
        ctx=this.ctx,
        ydis=this.H-this.padding*2-this.paddingTop,
        sl=this.series.filter(s=>!s.hide).length,
        sp=Math.max(Math.pow(10-sl,2)/3-4,5),
        w=(xs-sp*(sl+1))/sl,
        h,x,index=0;
    that.animateArr.length=0;
    // 展开数据项,填入动画队列
    for(var i=0,item,len=this.series.length;i<len;i++){
        item=this.series[i];
        if(item.hide)continue;
        item.data.slice(0,xl).forEach((d,j)=>{
            h=d/max*ydis;
            x=xs*j+w*index+sp*(index+1);
            that.animateArr.push({
                index:i,
                name:item.name,
                num:d,
                x:Math.round(x),
                y:1,
                w:Math.round(w),
                h:Math.floor(h+2),
                vy:Math.max(300,Math.floor(h*2))/100,
                color:item.color
            });
        });
        index++;
    }
    this.animate();
}Execute animation
There is nothing to say about executing animation. It is a self-executing closure function. The principle of animation is to sequentially accumulate the velocity value vy on the y-axis. But remember that when the queue finishes executing the animation, it needs to be stopped, so there is an isStop flag, which is judged every time the queue is finished executing.
animate(){
    var that=this,
        ctx=this.ctx,
        isStop=true;
    (function run(){
        isStop=true;
        for(var i=0,item;i<that.animateArr.length;i++){
            item=that.animateArr[i];
            if(item.y-item.h>=0.1){
                item.y=item.h;
            } else {
                item.y+=item.vy;
            }
            if(item.y<item.h){
                ctx.save();
                // ctx.translate(that.padding+item.x,that.H-that.padding);
                ctx.fillStyle=item.color;
                ctx.fillRect(that.padding+item.x,that.H-that.padding-item.y,item.w,item.y);
                ctx.restore();
                isStop=false;
            }
        }
        if(isStop)return;
        requestAnimationFrame(run);
    }())
}Binding event
Event 1: When mousemove, check whether the mouse position is on the group label or the data item, and call isPointInPath(x after drawing the path ,y), if true, canvas.style.cursor='pointer'; if it is a data item, the column must be redrawn, set transparency, and distinguished. The content also needs to be displayed. Here is a p with absolute positioning
relative to the parent container container. It has been established as the tip attribute during initialization. We encapsulate the display part into the showInfo method.bindEvent(){
var that=this,
canvas=this.canvas,
ctx=this.ctx;
this.canvas.addEventListener('mousemove',function(e){
var isLegend=false;
// pos=WindowToCanvas(canvas,e.clientX,e.clientY);
var box=canvas.getBoundingClientRect();
var pos = {
x:e.clientX-box.left,
y:e.clientY-box.top
};
// 分组标签
for(var i=0,item,len=that.legend.length;i<len;i++){
item=that.legend[i];
ctx.save();
roundRect(ctx,item.x,item.y,item.w,item.h,item.r);
// 因为缩小了一倍,所以坐标要*2
if(ctx.isPointInPath(pos.x*2,pos.y*2)){
canvas.style.cursor='pointer';
ctx.restore();
isLegend=true;
break;
}
canvas.style.cursor='default';
ctx.restore();
}
if(isLegend) return;
//选择数据项
for(var i=0,item,len=that.animateArr.length;i<len;i++){
item=that.animateArr[i];
ctx.save();
ctx.fillStyle=item.color;
ctx.beginPath();
ctx.rect(that.padding+item.x,that.H-that.padding-item.h,item.w,item.h);
if(ctx.isPointInPath(pos.x*2,pos.y*2)){
//清空后再重新绘制透明度为0.5的图形
ctx.clearRect(that.padding+item.x,that.H-that.padding-item.h,item.w,item.h);
ctx.globalAlpha=0.5;
ctx.fill();
canvas.style.cursor='pointer';
that.showInfo(pos,item);
ctx.restore();
break;
}
canvas.style.cursor='default';
that.tip.style.display='none';
ctx.globalAlpha=1;
ctx.fill();
ctx.restore();
}
},false);
this.canvas.addEventListener('mousedown',function(e){
e.preventDefault();
var box=canvas.getBoundingClientRect();
var pos = {
x:e.clientX-box.left,
y:e.clientY-box.top
};
for(var i=0,item,len=that.legend.length;i<len;i++){
item=that.legend[i];
roundRect(ctx,item.x,item.y,item.w,item.h,item.r);
// 因为缩小了一倍,所以坐标要*2
if(ctx.isPointInPath(pos.x*2,pos.y*2)){
that.series[i].hide=!that.series[i].hide;
that.animateArr.length=0;
that.draw();
break;
}
}
},false);
}
//显示数据
showInfo(pos,obj){
var txt=this.yAxis.formatter?this.yAxis.formatter.replace('{value}',obj.num):obj.num;
var box=this.canvas.getBoundingClientRect();
var con=this.container.getBoundingClientRect();
this.tip.innerHTML = '<p>'+obj.name+':'+txt+'</p>';
this.tip.style.left=(pos.x+(box.left-con.left)+10)+'px';
this.tip.style.top=(pos.y+(box.top-con.top)+10)+'px';
this.tip.style.display='block';
}相信看了本文案例你已经掌握了方法,更多精彩请关注php中文网其它相关文章!
推荐阅读:
The above is the detailed content of H5 canvas chart implements bar chart. For more information, please follow other related articles on the PHP Chinese website!

Hot AI Tools

Undresser.AI Undress
AI-powered app for creating realistic nude photos

AI Clothes Remover
Online AI tool for removing clothes from photos.

Undress AI Tool
Undress images for free

Clothoff.io
AI clothes remover

AI Hentai Generator
Generate AI Hentai for free.

Hot Article
Hot Tools

Notepad++7.3.1
Easy-to-use and free code editor

SublimeText3 Chinese version
Chinese version, very easy to use

Zend Studio 13.0.1
Powerful PHP integrated development environment

Dreamweaver CS6
Visual web development tools

SublimeText3 Mac version
God-level code editing software (SublimeText3)
Hot Topics
 1377
1377
 52
52

 Table Border in HTML
Sep 04, 2024 pm 04:49 PM
Table Border in HTML
Sep 04, 2024 pm 04:49 PM
Guide to Table Border in HTML. Here we discuss multiple ways for defining table-border with examples of the Table Border in HTML.
 HTML margin-left
Sep 04, 2024 pm 04:48 PM
HTML margin-left
Sep 04, 2024 pm 04:48 PM
Guide to HTML margin-left. Here we discuss a brief overview on HTML margin-left and its Examples along with its Code Implementation.
 Nested Table in HTML
Sep 04, 2024 pm 04:49 PM
Nested Table in HTML
Sep 04, 2024 pm 04:49 PM
This is a guide to Nested Table in HTML. Here we discuss how to create a table within the table along with the respective examples.
 HTML Table Layout
Sep 04, 2024 pm 04:54 PM
HTML Table Layout
Sep 04, 2024 pm 04:54 PM
Guide to HTML Table Layout. Here we discuss the Values of HTML Table Layout along with the examples and outputs n detail.
 HTML Input Placeholder
Sep 04, 2024 pm 04:54 PM
HTML Input Placeholder
Sep 04, 2024 pm 04:54 PM
Guide to HTML Input Placeholder. Here we discuss the Examples of HTML Input Placeholder along with the codes and outputs.
 HTML Ordered List
Sep 04, 2024 pm 04:43 PM
HTML Ordered List
Sep 04, 2024 pm 04:43 PM
Guide to the HTML Ordered List. Here we also discuss introduction of HTML Ordered list and types along with their example respectively
 Moving Text in HTML
Sep 04, 2024 pm 04:45 PM
Moving Text in HTML
Sep 04, 2024 pm 04:45 PM
Guide to Moving Text in HTML. Here we discuss an introduction, how marquee tag work with syntax and examples to implement.
 HTML onclick Button
Sep 04, 2024 pm 04:49 PM
HTML onclick Button
Sep 04, 2024 pm 04:49 PM
Guide to HTML onclick Button. Here we discuss their introduction, working, examples and onclick Event in various events respectively.
