Sharing of advanced techniques for debugging via Console
Usually, when we write a new JavaScript code, errors often occur. It may be a syntax error or a logic error. If there is no debugging tool to help us, I believe your head will explode. The following article mainly summarizes and introduces 10 advanced techniques for using Console to debug. I hope it can help you.
Preface
Over the past ten years, one of my biggest passions has been front-end development (especially JavaScript). As a "craftsman", I like to specialize in various tools. In this article, I will introduce you to some debugging techniques using the old-fashioned console.
Yes, we all know the following basic skills:
console.log(‘Hello World!');
console.info(‘Something happened…');
console.warn(‘Something strange happened…');
console.error(‘Something horrible happened…');
From now on, I will teach you some skills you don’t know and let you become an experienced driver!
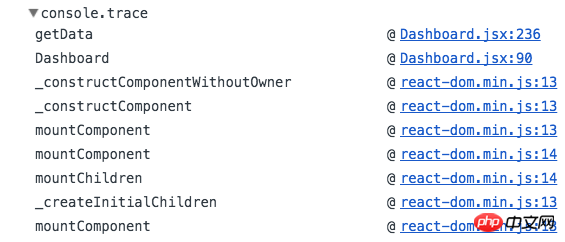
1. console.trace()
If you want to know where the message is printed, use console.trace() to get the stacktrace of the data to be printed.

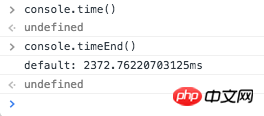
2. console.time() && console.timeEnd()
If you want to analyze the performance of the function, you can use console.time () to time, console.timeEnd() to end the time, and the console will print out the time difference between the two times.

3. console.memory
If you find that the performance problem is difficult to analyze, and you may also want to consider whether there is a memory leak, you can use console.memory (note that memory is a property of console, not a function) to check the current heap usage.

4. console.profile('profileName') & console.profileEnd('profileName')
Although it is not a standard approach, However, it is widely accepted and used. You can use these two commands to start and stop profiling. This helps you do accurate profiling in your code. Rather than relying on manual mouse clicks. You can find the profile just now in the browser console JavaScript Profiler.

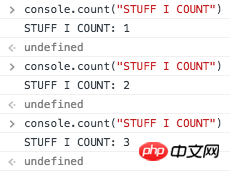
5. console.count(“STUFF I COUNT”)
Sometimes in order to record how many times a function or a piece of code has been executed repeatedly times, you can use console.count('?') to record. Every time this code is executed, it will automatically increase by 1.

6. console.assert(false, “Log me!”)
You can use console.assert to indicate that something is false Output the message under the condition instead of using if-else.
Note: An Assertion Error will be reported under Node.js.

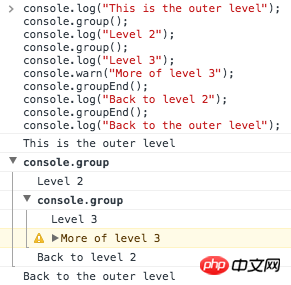
7. console.group('group') & console.groupEnd('group')
If you want to print the log To do a formatting arrangement, you can use console.group() and console.groupEnd(). Use console.group to aggregate logs into groups and form nested hierarchies.
Please see the example:

8. String substitutions
You can use console.log to print variables (%s = string, %i = integer, %o = object, %f = float).

9. console.clear()
We have output a lot of records on the console, let’s use console.clear() to clear them .

10. console.table()
The last one! You can use console.table() to print the object in table form.

Related recommendations:
Sharing of 5 debugging skills essential for JavaScript debugging
The above is the detailed content of Sharing of advanced techniques for debugging via Console. For more information, please follow other related articles on the PHP Chinese website!

Hot AI Tools

Undresser.AI Undress
AI-powered app for creating realistic nude photos

AI Clothes Remover
Online AI tool for removing clothes from photos.

Undress AI Tool
Undress images for free

Clothoff.io
AI clothes remover

Video Face Swap
Swap faces in any video effortlessly with our completely free AI face swap tool!

Hot Article

Hot Tools

Notepad++7.3.1
Easy-to-use and free code editor

SublimeText3 Chinese version
Chinese version, very easy to use

Zend Studio 13.0.1
Powerful PHP integrated development environment

Dreamweaver CS6
Visual web development tools

SublimeText3 Mac version
God-level code editing software (SublimeText3)

Hot Topics
 1387
1387
 52
52
 How to share Quark Netdisk to Baidu Netdisk?
Mar 14, 2024 pm 04:40 PM
Quark Netdisk and Baidu Netdisk are very convenient storage tools. Many users are asking whether these two softwares are interoperable? How to share Quark Netdisk to Baidu Netdisk? Let this site introduce to users in detail how to save Quark network disk files to Baidu network disk. How to save files from Quark Network Disk to Baidu Network Disk Method 1. If you want to know how to transfer files from Quark Network Disk to Baidu Network Disk, first download the files that need to be saved on Quark Network Disk, and then open the Baidu Network Disk client. , select the folder where the compressed file is to be saved, and double-click to open the folder. 2. After opening the folder, click "Upload" in the upper left corner of the window. 3. Find the compressed file that needs to be uploaded on your computer and click to select it.
 Pre-orders open for new Nintendo Switch Lite refresh
Jun 29, 2024 am 06:49 AM
Nintendo has opened pre-orders for the latest version of the Switch Lite (curr. $189.99 on Amazon). However, the device is not available to order globally just yet. To recap, the company presented the Switch Lite Hyrule Edition almost two weeks ago d
 What does console mean?
Sep 05, 2023 pm 02:43 PM
Console means console. It is a device or software that interacts with a computer system. It is usually a device with a keyboard and a screen for inputting and outputting information. The console was originally Used for large computer systems, and later also applied to personal computers and servers, it can help users manage and maintain computer systems, as well as install operating systems and applications, debug programs, etc.
 How to share NetEase Cloud Music to WeChat Moments_Tutorial on sharing NetEase Cloud Music to WeChat Moments
Mar 25, 2024 am 11:41 AM
1. First, we enter NetEase Cloud Music, and then click on the software homepage interface to enter the song playback interface. 2. Then in the song playback interface, find the sharing function button in the upper right corner, as shown in the red box in the figure below, click to select the sharing channel; in the sharing channel, click the "Share to" option at the bottom, and then select the first "WeChat Moments" allows you to share content to WeChat Moments.
 Clear console output using Console.Clear function in C#
Nov 18, 2023 am 11:00 AM
Use the Console.Clear function in C# to clear the console output. In C# console applications, we often need to clear the output information in the console in order to display new content or provide a better user experience. C# provides the Console.Clear function to implement this function, which can clear the output in the console and make the interface blank again. The calling format of the Console.Clear function is as follows: Console.Clear(); This function does not require any input
 How to share files with friends on Baidu Netdisk
Mar 25, 2024 pm 06:52 PM
Recently, Baidu Netdisk Android client has ushered in a new version 8.0.0. This version not only brings many changes, but also adds many practical functions. Among them, the most eye-catching is the enhancement of the folder sharing function. Now, users can easily invite friends to join and share important files in work and life, achieving more convenient collaboration and sharing. So how do you share the files you need to share with your friends? Below, the editor of this site will give you a detailed introduction. I hope it can help you! 1) Open Baidu Cloud APP, first click to select the relevant folder on the homepage, and then click the [...] icon in the upper right corner of the interface; (as shown below) 2) Then click [+] in the "Shared Members" column 】, and finally check all
 Nintendo announces new Switch Lite refresh before Switch 2 release
Jun 20, 2024 am 09:41 AM
Nintendo presented plenty of games yesterday during its most recent Nintendo Direct event, an overview of which we have provided separately. Additionally, the company also announced a new version of the Switch Lite (curr. $194.93 on Amazon), possibly
 What are the activation keys for win7 enterprise edition?
Jul 09, 2023 pm 03:01 PM
Do you have the latest activation key for win7 enterprise edition? If you install the official win7 enterprise version, you will be prompted to activate it with the windows7 enterprise product key, otherwise it will not work properly. So the editor will share with you some win7 enterprise version activation passwords, let's take a look. Q3VMJ-TMJ3M-99RF9-CVPJ3-Q7VF3KGMPT-GQ6XF-DM3VM-HW6PR-DX9G8MT39G-9HYXX-J3V3Q-RPXJB-RQ6D79JBBV-7Q7P7-CTDB7-KYBKG-X8HHCP72QK-2Y3B8-YDHDV-29DQB-QKWWM6 JQ


