This time I will bring you a detailed picture and text explanation of the introduction of highcharts into vue. What are the precautions for introducing highcharts into vue. Here are practical cases, let’s take a look.
npm imports highchars. After the import is completed, you can develop the visual component of highchars
npm install highcharts --save
1. Create a new chart.vue component in the components directory
<template>
 <p class="x-bar">
 <p :id="id"
 :option="option"></p>
 </p>
</template>
<script>
import HighCharts from 'highcharts'
export default {
 // 验证类型
 props: {
 id: {
 type: String
 },
 option: {
 type: Object
 }
 },
 mounted() {
 HighCharts.chart(this.id,this.option)
 }
}
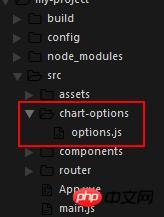
</script>2. After the chart component is built, start creating the chart-options directory, and create an options.js in it to store the simulated chart data, as shown in the directory below

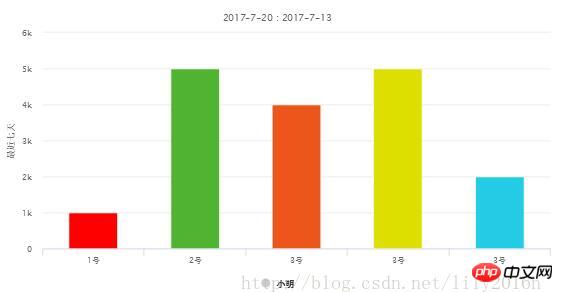
As shown below, the data of a histogram I wrote
module.exports = {
 bar: {
 chart: {
 type:'column'//指定图表的类型,默认是折线图(line)
 },
 credits: {
 enabled:false
 },//去掉地址
 title: {
 text: '我的第一个图表' //指定图表标题
 },
 colors: ['#058DC7', '#50B432', '#ED561B', '#DDDF00',
  '#24CBE5' ],
 xAxis: {
  categories: ['1号', '2号', '3号','3号','3号'] //指定x轴分组
 },
 yAxis: {
  title: {
  text: '最近七天', //指定y轴的标题
 },
 },
 plotOptions: {
  column: {
  colorByPoint:true
  },
  },
 series: [{ //指定数据列
  name: '小明',
  data: [{
  y:1000,
  color:"red"}, 5000, 4000,5000,2000] //数据
 }]
 }
}3, Quotechart component
<template>
 <p id="app">
 <x-chart :id="id" :option="option"></x-chart>
 </p>
</template>
<script>
// 导入chart组件
import XChart from 'components/chart.vue'
// 导入chart组件模拟数据
import options from './chart-options/options'
export default {
 name: 'app',
 data() {
 let option = options.bar
 return {
 id: 'test',
 option: option
 }
 },
 components: {
 XChart
 }
}
</script>
<style>
#test {
 width: 400px;
 height: 400px;
 margin: 40px auto;
}
</style>The effect is as shown in the figure below

I believe you have read the case in this article After mastering the method, please pay attention to other related articles on the php Chinese website for more exciting content!
Recommended reading:
Why axios http request cannot be used in vue2
POST request parameters are passed when vue handles axios question
The above is the detailed content of Detailed graphic explanation of highcharts introduced in vue. For more information, please follow other related articles on the PHP Chinese website!


