 Backend Development
 PHP Tutorial
 Distributed real-time log analysis solution ELK deployment architecture
Distributed real-time log analysis solution ELK deployment architecture
ELK has become the most popular centralized log solution at present. It is mainly composed of Beats, Logstash, Elasticsearch, Kibana and other components to jointly complete the collection, storage, display and other one-stop solutions of real-time logs. This article mainly introduces you to the distributed real-time log analysis solution ELK deployment architecture. Friends in need can take a look at
Course Recommendation →: 《 Elasticsearch full-text search practice" (practical video)
From the course "Ten million-level data concurrency solution (theory + practice)"
1 , Overview
ELK has become the most popular centralized log solution at present. It is mainly composed of Beats, Logstash, Elasticsearch, Kibana and other components to jointly complete the collection, storage and display of real-time logs in one stop. solution. This article will introduce the common architecture of ELK and solve related problems.
Filebeat: Filebeat is a lightweight data collection engine that takes up very few service resources. It is a new member of the ELK family and can replace Logstash as the log collection on the application server. The engine supports outputting collected data to queues such as Kafka and Redis.
Logstash: Data collection engine, which is more heavyweight than Filebeat, but it integrates a large number of plug-ins and supports the collection of rich data sources. The collected data can be filtered and analyzed. Format log format.
Elasticsearch: Distributed data search engine, implemented based on Apache
Lucene, can be clustered, and provides centralized storage and analysis of data, as well as powerful data search and aggregation functions.Kibana: A data visualization platform. This web platform allows you to view relevant data in Elasticsearch in real time and provides rich chart statistics.
2. ELK common deployment architecture
2.1. Logstash as a log collector
This architecture is relatively primitive Deployment architecture: deploy a Logstash component on each application server as a log collector, then filter, analyze, and format the data collected by Logstash and send it to Elasticsearch storage, and finally use Kibana for visual display. This architecture is insufficient The key point is: Logstash consumes more server resources, so it will increase the load pressure on the application server.
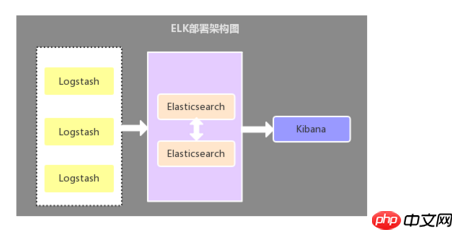
2.2. Filebeat as a log collector
The only difference between this architecture and the first architecture Yes: The application-side log collector is replaced by Filebeat. Filebeat is lightweight and takes up less server resources, so Filebeat is used as the application server-side log collector. Generally, Filebeat is used together with Logstash. This deployment method is also the most commonly used architecture at present. .

2.3. Deployment architecture that introduces cache queue
This architecture is based on the second architecture The Kafka message queue (can also be other message queues) is introduced, the data collected by Filebeat is sent to Kafka, and then the data in Kafka is read through Logstasth. This architecture is mainly used to solve log collection solutions under large data volumes. , using cache queues is mainly to solve data security and balance the load pressure of Logstash and Elasticsearch.

##2.4. Summary of the above three architectures
The first deployment architecture has resource occupancy issues , is now rarely used, and the second deployment architecture is currently the most used. As for the third deployment architecture, I personally feel that there is no need to introduce a message queue, unless there are other needs, because in the case of large amounts of data, Filebeat usage pressure Sensitive protocols send data to Logstash or Elasticsearch. If Logstash is busy processing data, it tells Filebeat to slow down its reads. Once the congestion is resolved, Filebeat will resume its original speed and continue sending data. Recommend a communication and learning group: 478030634 which will share some videos recorded by senior architects: Spring, MyBatis, Netty source code analysis, principles of high concurrency, high performance, distributed and microservice architecture, JVM Performance optimization has become a necessary knowledge system for architects. You can also receive free learning resources and benefit a lot so far:
Problem : How to implement the multi-line merging function of logs?
Logs in system applications are generally printed in a specific format. Data belonging to the same log may be printed in multiple lines. Therefore, when using ELK to collect logs, you need to separate multiple lines of data belonging to the same log. Merge.
Solution: Use the multiline multi-line merge plug-in in Filebeat or Logstash to achieve
When using the multiline multi-line merge plug-in, you need to pay attention to different ELK deployments The architecture may also use multiline differently. If it is the first deployment architecture in this article, then multiline needs to be configured and used in Logstash. If it is the second deployment architecture, then multiline needs to be configured and used in Filebeat, and there is no need to configure it in Logstash. Configure multiline.
1. How to configure multiline in Filebeat:

- ##pattern : Regular expression
- negate: The default is false, which means that lines matching pattern are merged into the previous line; true means that lines that do not match pattern are merged into the previous line.
- match: after means merging to the end of the previous line, before means merging to the beginning of the previous line
negate: true
match: after
2. Multiline in Logstash Configuration method

(2) pattern => "%{LOGLEVEL}s*]" The LOGLEVEL in "%{LOGLEVEL}s*]" is Logstash's pre-made regular matching pattern. There are many pre-made regular matching patterns. For details, please see: https://github .com/logstash-p...
Question: How to replace the time field of the log displayed in Kibana with the time in the log information?
By default, the time field we view in Kibana is inconsistent with the time in the log information. Because the default time field value is the current time when the log is collected, the time of this field needs to be changed. Replace with the time in the log message.Solution: Use the grok word segmentation plug-in and date time formatting plug-in to achieve
Configure the grok word segmentation plug-in and date time format in the filter of the Logstash configuration file plug-in, such as: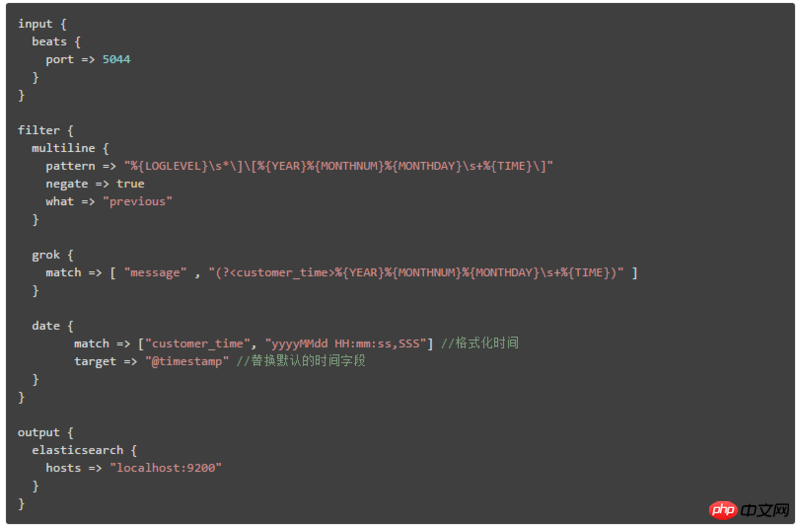
CUSTOMER_TIME %{YEAR}%{MONTHNUM}%{MONTHDAY}s+ %{TIME}
Note: The content format is: [custom expression name] [regular expression]
Then it can be quoted in logstash like this:


Question: How to view data in Kibana by selecting different system log modules
Generally, the log data displayed in Kibana mixes data from different system modules , so how to select or filter to view only the log data of the specified system module?Solution: Add fields that identify different system modules or build ES indexes based on different system modules
1. Add fields that identify different system modules, and then Kibana can filter and query data from different modules based on this field Here we will explain the second deployment architecture. The configuration content in Filebeat is:
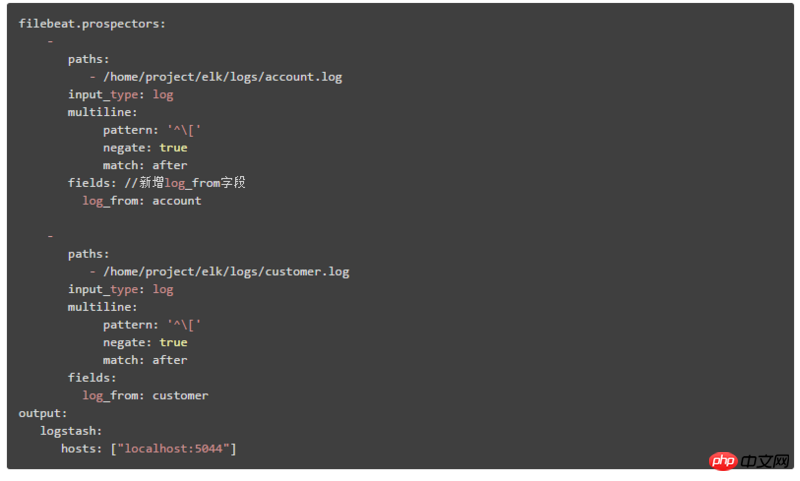 Identify different system module logs by adding: log_from field
The second deployment architecture is explained here, which is divided into two steps:
① The configuration content in Filebeat is:
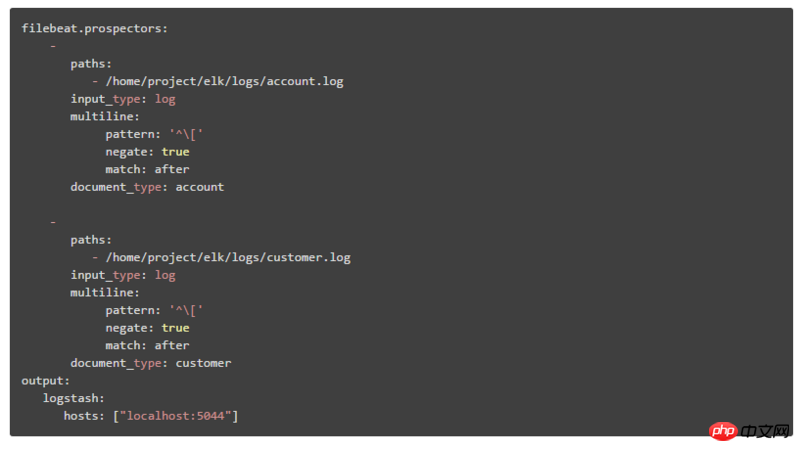 through document_type Identify different system modules
Add the index attribute to the output, %{type} means to build an ES index based on different document_type values
4. Summary
This article mainly introduces the three deployment architectures of ELK real-time log analysis, as well as the problems that different architectures can solve. Among these three architectures, the second deployment method is the most popular and the most popular nowadays. The most commonly used deployment method, and finally introduces some problems and solutions of ELK in log analysis. In the end, ELK can not only be used for centralized query and management of distributed log data, but also can be used as a project application. As well as server resource monitoring and other scenarios.
The above is the detailed content of Distributed real-time log analysis solution ELK deployment architecture. For more information, please follow other related articles on the PHP Chinese website!

Hot AI Tools

Undresser.AI Undress
AI-powered app for creating realistic nude photos

AI Clothes Remover
Online AI tool for removing clothes from photos.

Undress AI Tool
Undress images for free

Clothoff.io
AI clothes remover

Video Face Swap
Swap faces in any video effortlessly with our completely free AI face swap tool!

Hot Article

Hot Tools

Notepad++7.3.1
Easy-to-use and free code editor

SublimeText3 Chinese version
Chinese version, very easy to use

Zend Studio 13.0.1
Powerful PHP integrated development environment

Dreamweaver CS6
Visual web development tools

SublimeText3 Mac version
God-level code editing software (SublimeText3)

Hot Topics
 Solution for Win11 unable to install Chinese language pack
Mar 09, 2024 am 09:15 AM
Win11 is the latest operating system launched by Microsoft. Compared with previous versions, Win11 has greatly improved the interface design and user experience. However, some users reported that they encountered the problem of being unable to install the Chinese language pack after installing Win11, which caused trouble for them to use Chinese in the system. This article will provide some solutions to the problem that Win11 cannot install the Chinese language pack to help users use Chinese smoothly. First, we need to understand why the Chinese language pack cannot be installed. Generally speaking, Win11
 An effective solution to solve the problem of garbled characters caused by Oracle character set modification
Mar 03, 2024 am 09:57 AM
Title: An effective solution to solve the problem of garbled characters caused by Oracle character set modification. In Oracle database, when the character set is modified, the problem of garbled characters often occurs due to the presence of incompatible characters in the data. In order to solve this problem, we need to adopt some effective solutions. This article will introduce some specific solutions and code examples to solve the problem of garbled characters caused by Oracle character set modification. 1. Export data and reset the character set. First, we can export the data in the database by using the expdp command.
 Oracle NVL function common problems and solutions
Mar 10, 2024 am 08:42 AM
Common problems and solutions for OracleNVL function Oracle database is a widely used relational database system, and it is often necessary to deal with null values during data processing. In order to deal with the problems caused by null values, Oracle provides the NVL function to handle null values. This article will introduce common problems and solutions of NVL functions, and provide specific code examples. Question 1: Improper usage of NVL function. The basic syntax of NVL function is: NVL(expr1,default_value).
 Implementing Machine Learning Algorithms in C++: Common Challenges and Solutions
Jun 03, 2024 pm 01:25 PM
Common challenges faced by machine learning algorithms in C++ include memory management, multi-threading, performance optimization, and maintainability. Solutions include using smart pointers, modern threading libraries, SIMD instructions and third-party libraries, as well as following coding style guidelines and using automation tools. Practical cases show how to use the Eigen library to implement linear regression algorithms, effectively manage memory and use high-performance matrix operations.
 Common causes and solutions for Chinese garbled characters in MySQL installation
Mar 02, 2024 am 09:00 AM
Common reasons and solutions for Chinese garbled characters in MySQL installation MySQL is a commonly used relational database management system, but you may encounter the problem of Chinese garbled characters during use, which brings trouble to developers and system administrators. The problem of Chinese garbled characters is mainly caused by incorrect character set settings, inconsistent character sets between the database server and the client, etc. This article will introduce in detail the common causes and solutions of Chinese garbled characters in MySQL installation to help everyone better solve this problem. 1. Common reasons: character set setting
 Common causes and solutions for Chinese garbled characters in PHP
Mar 16, 2024 am 11:51 AM
Common causes and solutions for PHP Chinese garbled characters. With the development of the Internet, Chinese websites play an increasingly important role in our lives. However, in PHP development, the problem of Chinese garbled characters is still a common problem that troubles developers. This article will introduce the common causes of Chinese garbled characters in PHP and provide solutions. It also attaches specific code examples for readers' reference. 1. Common reasons: Inconsistent character encoding: Inconsistencies in PHP file encoding, database encoding, HTML page encoding, etc. may lead to Chinese garbled characters. database
 Analysis and solutions for why Black Shark mobile phone automatically shuts down and turns on while charging
Mar 24, 2024 pm 02:09 PM
The Black Shark mobile phone is a gaming phone popular among young people. Its excellent performance and unique design have attracted the favor of many players. However, in daily use, some users reported that Black Shark phones automatically shut down when charging or failed to start after being connected to a charger, which caused trouble to users. This article will discuss the problem of automatic shutdown and startup of Black Shark mobile phones from the aspects of cause analysis and solutions to help users better solve this problem. 1. Cause Analysis Charger Quality Issues: Low-quality chargers may cause voltage instability, or
 Analysis of the reasons why the secondary directory of DreamWeaver CMS cannot be opened
Mar 13, 2024 pm 06:24 PM
Title: Analysis of the reasons and solutions for why the secondary directory of DreamWeaver CMS cannot be opened. Dreamweaver CMS (DedeCMS) is a powerful open source content management system that is widely used in the construction of various websites. However, sometimes during the process of building a website, you may encounter a situation where the secondary directory cannot be opened, which brings trouble to the normal operation of the website. In this article, we will analyze the possible reasons why the secondary directory cannot be opened and provide specific code examples to solve this problem. 1. Possible cause analysis: Pseudo-static rule configuration problem: during use


