

The example in this article describes the drawing of graphics in Python. Share it with everyone for your reference, the details are as follows:
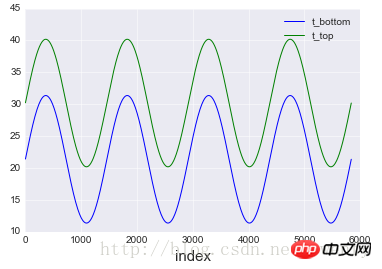
1. Add data labels to the graph
plt.plot(datat.index,datat)
plt.xlabel('index', fontsize=15)
plt.legend(['t_bottom','t_top'],loc = 'upper_right',fontsize = 10)
plt.show()
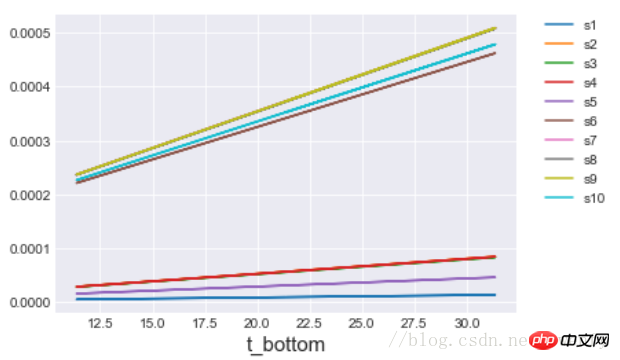
2. Set the labels On the far right
plt.legend(bbox_to_anchor=(1.05, 1), loc=2, borderaxespad=0.)
3, a box appears when displaying Chinese fonts
# coding: UTF-8
import matplotlib.pyplot as plt
plt.rcParams['font.sans-serif']=['SimHei'] #用来正常显示中文标签
plt.rcParams['axes.unicode_minus']=False #用来正常显示负号#有中文出现的情况,需要u'内容
4. Draw a heat map
import pandas as pd
import numpy as np
import matplotlib.pyplot as plt
import seaborn as sns
d ={'1':[0.87,0.95],'2':[0.86,0.91],'3':[0.86,0.93],'4':[0.86,0.92],'5':[0.86,0.93]}
df = pd.DataFrame(d,index = [2,1])
df
### annot是表示显示方块代表的数值出来 cmap颜色
sns.heatmap(df,annot = True,cmap="YlGnBu")
plt.show()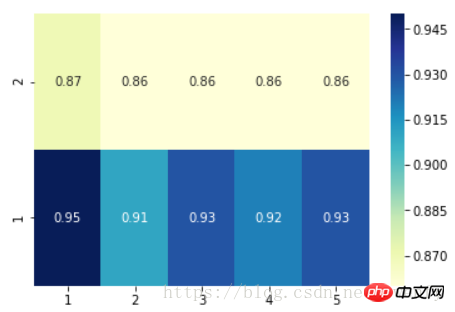
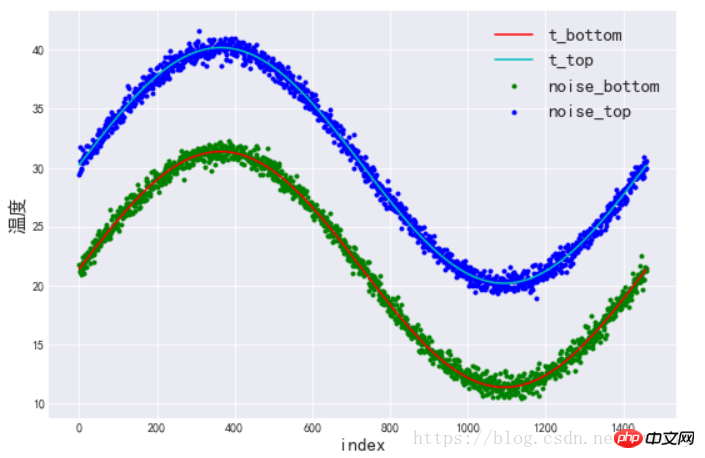
5. Draw a scatter plot and overlap multiple graphs
import matplotlib.pyplot as plt
import seaborn as sns
color = sns.color_palette()
sns.set_style('darkgrid')
%matplotlib inline
plt.rcParams['font.sans-serif']=['SimHei'] #用来正常显示中文标签
plt.rcParams['axes.unicode_minus']=False #用来正常显示负号#有中文出现的情况,需要u'内容'

plt.figure(figsize=[9,6])
plt.plot(datat.index,datat_.t_bottom,color = 'r')
plt.plot(datat.index,datat_.t_top,color = 'c')
plt.scatter(datat.index,datat_.bottom,marker='.',c='g')
plt.scatter(datat.index,datat_.top,marker='.',c='b')
plt.legend(('t_bottom','t_top','noise_bottom','noise_top'),loc = 'upper right',fontsize=15)
plt.xlabel('index', fontsize=15)
plt.ylabel(u'温度', fontsize=15)
#plt.legend(['t_bottom','t_top'],loc = 'upper_right',fontsize = 10)
plt.show()
| character | color |
|---|---|
<span class="pre">'b'</span>
|
blue |
##'g'<span class="pre"></span> | green|
'r'<span class="pre"></span> | red|
'c'<span class="pre"></span> | cyan|
##'m'<span class="pre"></span>magenta |
|
'y'<span class="pre"></span>yellow |
|
'k'<span class="pre"></span>black |
|
<span class="pre"></span>white
|
##Related recommendations:
Draw custom graphics
Use the turtle library in python to draw graphics
The above is the detailed content of Drawing of graphics in python. For more information, please follow other related articles on the PHP Chinese website!


![[Web front-end] Node.js quick start](https://img.php.cn/upload/course/000/000/067/662b5d34ba7c0227.png)


