

How to download China map in .js file format with Echarts

The content of this article is about how Echarts downloads the China map in .js file format. It has certain reference value. Now I share it with you. Friends in need can refer to it
When using the China map of Echarts in the morning, you need to use the china.js file, but the official map js download of Echarts has been suspended for download. After searching, there is the following link to download:
1.Github Address: https://github.com/apache/incubator-echarts
2. Baidu cloud network disk (please leave a message if it fails and I will update it as soon as possible):
Link: https://pan.baidu.com/s/1j_edGU2ka9YeHBTErqDWdg Password: ft9n
After downloading, you need to introduce the link in html or jsp as follows:
<script type="text/javascript" src="echarts/china.js"></script>
Finally The effect is as follows: 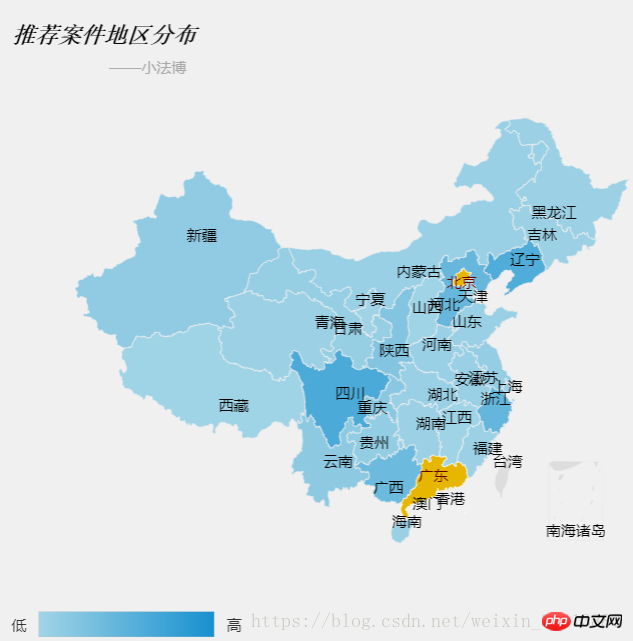
Let’s talk about the theme of the map again. You can also go to the official website to download the js file. If you download the shine theme, the following code is introduced:
<script type="text/javascript" src="echarts/shine.js"></script>
.........
     var myChart = echarts.init(document.getElementById('main'),'shine');.........
Related recommendations:
##Baidu The use of Echarts chart JS plug-in
The above is the detailed content of How to download China map in .js file format with Echarts. For more information, please follow other related articles on the PHP Chinese website!

Hot AI Tools

Undresser.AI Undress
AI-powered app for creating realistic nude photos

AI Clothes Remover
Online AI tool for removing clothes from photos.

Undress AI Tool
Undress images for free

Clothoff.io
AI clothes remover

AI Hentai Generator
Generate AI Hentai for free.

Hot Article
Hot Tools

Notepad++7.3.1
Easy-to-use and free code editor

SublimeText3 Chinese version
Chinese version, very easy to use

Zend Studio 13.0.1
Powerful PHP integrated development environment

Dreamweaver CS6
Visual web development tools

SublimeText3 Mac version
God-level code editing software (SublimeText3)
Hot Topics
 1378
1378
 52
52

 How to use php interface and ECharts to generate visual statistical charts
Dec 18, 2023 am 11:39 AM
How to use php interface and ECharts to generate visual statistical charts
Dec 18, 2023 am 11:39 AM
In today's context where data visualization is becoming more and more important, many developers hope to use various tools to quickly generate various charts and reports so that they can better display data and help decision-makers make quick judgments. In this context, using the Php interface and ECharts library can help many developers quickly generate visual statistical charts. This article will introduce in detail how to use the Php interface and ECharts library to generate visual statistical charts. In the specific implementation, we will use MySQL
 Steps to draw dashboard using ECharts and Python interface
Dec 18, 2023 am 08:40 AM
Steps to draw dashboard using ECharts and Python interface
Dec 18, 2023 am 08:40 AM
The steps to draw a dashboard using ECharts and Python interface require specific code examples. Summary: ECharts is an excellent data visualization tool that can easily perform data processing and graphics drawing through the Python interface. This article will introduce the specific steps to draw a dashboard using ECharts and Python interface, and provide sample code. Keywords: ECharts, Python interface, dashboard, data visualization Introduction Dashboard is a commonly used form of data visualization, which uses
 How to use map heat map to display city heat in ECharts
Dec 18, 2023 pm 04:00 PM
How to use map heat map to display city heat in ECharts
Dec 18, 2023 pm 04:00 PM
How to use a map heat map to display city heat in ECharts ECharts is a powerful visual chart library that provides various chart types for developers to use, including map heat maps. Map heat maps can be used to show the popularity of cities or regions, helping us quickly understand the popularity or density of different places. This article will introduce how to use the map heat map in ECharts to display city heat, and provide code examples for reference. First, we need a map file containing geographic information, EC
 How to use calendar charts to display time data in ECharts
Dec 18, 2023 am 08:52 AM
How to use calendar charts to display time data in ECharts
Dec 18, 2023 am 08:52 AM
How to use calendar charts to display time data in ECharts ECharts (Baidu’s open source JavaScript chart library) is a powerful and easy-to-use data visualization tool. It offers a variety of chart types, including line charts, bar charts, pie charts, and more. The calendar chart is a very distinctive and practical chart type in ECharts, which can be used to display time-related data. This article will introduce how to use calendar charts in ECharts and provide specific code examples. First, you need to use
 Simple JavaScript Tutorial: How to Get HTTP Status Code
Jan 05, 2024 pm 06:08 PM
Simple JavaScript Tutorial: How to Get HTTP Status Code
Jan 05, 2024 pm 06:08 PM
JavaScript tutorial: How to get HTTP status code, specific code examples are required. Preface: In web development, data interaction with the server is often involved. When communicating with the server, we often need to obtain the returned HTTP status code to determine whether the operation is successful, and perform corresponding processing based on different status codes. This article will teach you how to use JavaScript to obtain HTTP status codes and provide some practical code examples. Using XMLHttpRequest
 How to insert graphics and text of China map into wps document
Mar 27, 2024 pm 02:01 PM
How to insert graphics and text of China map into wps document
Mar 27, 2024 pm 02:01 PM
1. Open the wps software and enter the wps text operation interface. 2. Find the insert option in this interface. 3. Click the Insert option and find the Shape option in its editing area. 4. Click the shape option and find the recommended option in its sub-menu. 5. Find the China map option in the recommended options. 6. Click on the China map option and drag it with the left mouse button in the editing input area to get the China map we need.
 How to use ECharts and php interface to generate statistical charts
Dec 18, 2023 pm 01:47 PM
How to use ECharts and php interface to generate statistical charts
Dec 18, 2023 pm 01:47 PM
How to use ECharts and PHP interfaces to generate statistical charts Introduction: In modern web application development, data visualization is a very important link, which can help us display and analyze data intuitively. ECharts is a powerful open source JavaScript chart library. It provides a variety of chart types and rich interactive functions, and can easily generate various statistical charts. This article will introduce how to use ECharts and PHP interfaces to generate statistical charts, and give specific code examples. 1. Overview of ECha
 How to use histogram to display data in ECharts
Dec 18, 2023 pm 02:21 PM
How to use histogram to display data in ECharts
Dec 18, 2023 pm 02:21 PM
How to use histograms to display data in ECharts ECharts is a JavaScript-based data visualization library that is very popular and widely used in the field of data visualization. Among them, the histogram is the most common and commonly used chart type, which can be used to display the size, comparison and trend analysis of various numerical data. This article will introduce how to use ECharts to draw histograms and provide code examples. First, we need to introduce the ECharts library into the HTML file, which can be introduced in the following way
