
 Web Front-end
JS Tutorial
Practical development of JavaScript using DeviceOne (2) Generating debugging installation package_javascript skills
Web Front-end
JS Tutorial
Practical development of JavaScript using DeviceOne (2) Generating debugging installation package_javascript skills
Practical development of JavaScript using DeviceOne (2) Generating debugging installation package_javascript skills

In the last article, I introduced you to JavaScript development using DeviceOne (1) Configuration and start . This article will continue to introduce you to the relevant content about JavaScript practice. Let’s learn together.
Generate debugging installation package
First of all, it should be noted that this step is not necessary every time you debug the App. In most cases, the debugging installation package is generated once, and you can ignore this entire step after installing it on the phone. Because the debugging installation package contains many native components, all of which can be customized and selected. If you need to add some additional native components, you need to select more components and regenerate the debugging installation package.
Click the "Build Debug Version" button in the debugger menu. If you have not logged in, you will be prompted to log in

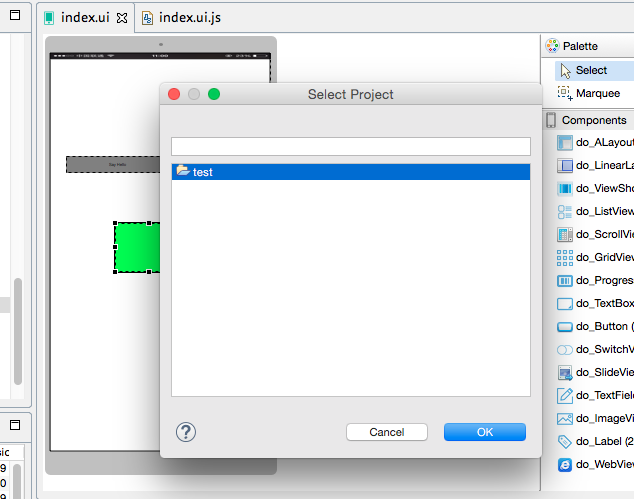
If you have multiple projects open, you need to select a specific project you want to package, and you need to be online when packaging.
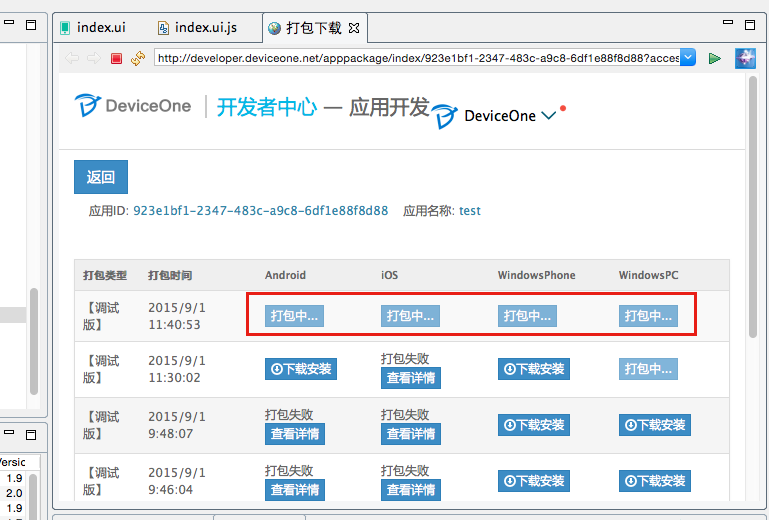
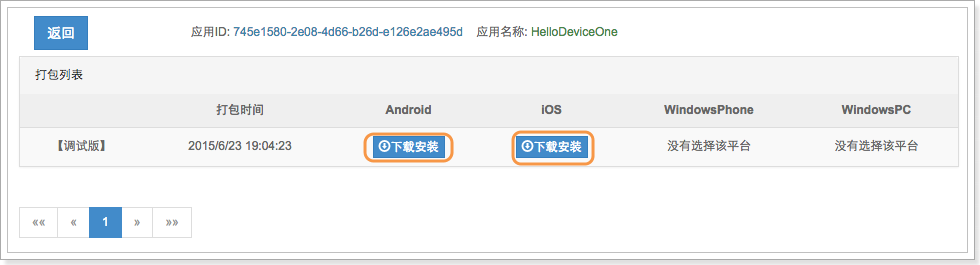
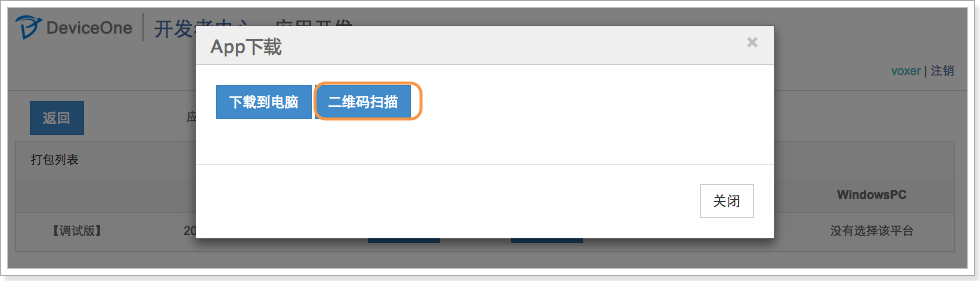
It only takes a few minutes, "Packaging..." will be completed and change to "Download and Install". After clicking, you can choose to install the QR code or download the file to your computer and install it on your phone through the tool.
Debugging and Development
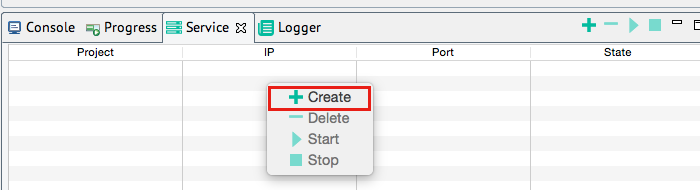
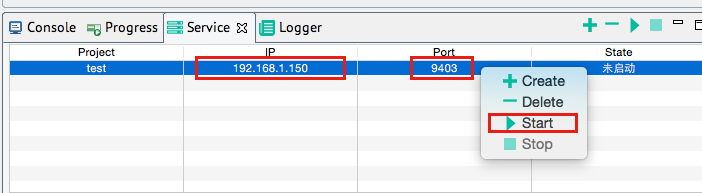
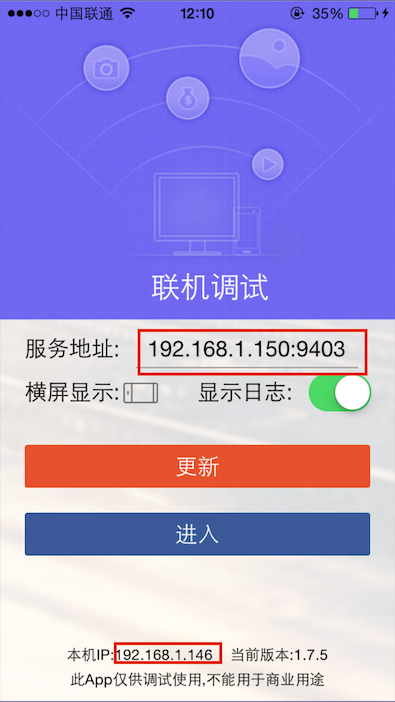
After installing the installation package generated in the previous step on the mobile device (mobile phone or pad), the basic interface is as follows. The basic interface is the same for Android, IOS and Winphone. To debug, you need to right-click the "Create" button on "Service" in the designer, then click "Start" to start the service, record the displayed IP address and port number, and then enter the IP address into the "Service Address" of the debug version on the mobile phone. ”, please make sure that the IP of the mobile phone and the IP of the designer are in the same network segment, otherwise communication will not be possible. Finally, click the "Update" button
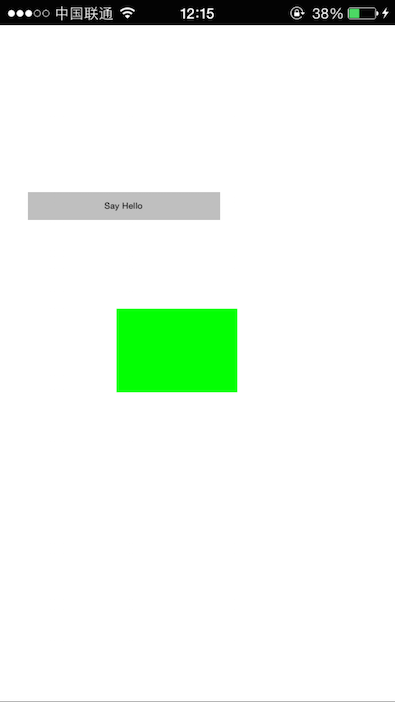
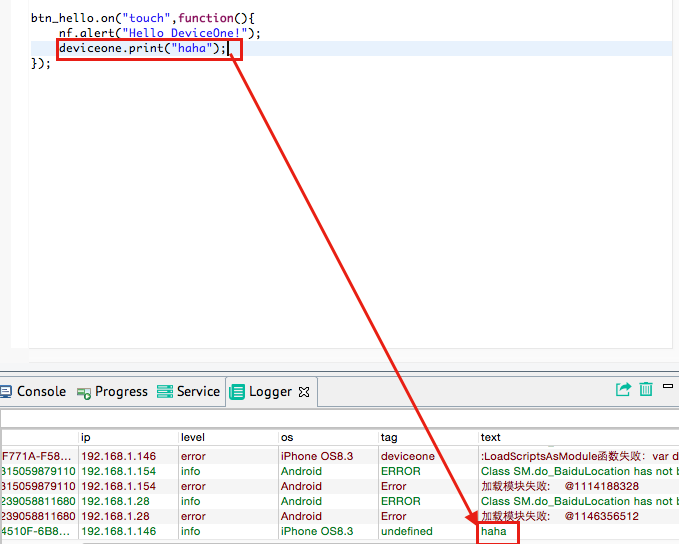
After the update is successful, click the "Enter" button to see the real effect of the App developed on the designer on the mobile phone. We can see that the effect is exactly the same as that seen on the designer, and we can see the green color label, you can also click the "Say Hello" button, and "Hello DeviceOne!!!" will pop up. In this way, we can continue to modify the code and UI on the designer, and then click the "Update" button and the "Enter" button again to see the development effect in real time. Until this App completes all the functions you need.
Single-step debugging is not supported yet. Currently, alert, toast mode debugging and deviceone.print debugging are supported. Among them, print debugging can display the printed data in the "Debug Log" of the designer in real time, but you need to ensure that the "Show Log" of the debugging terminal is checked.
Publish application
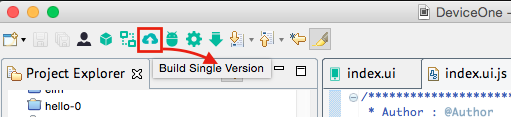
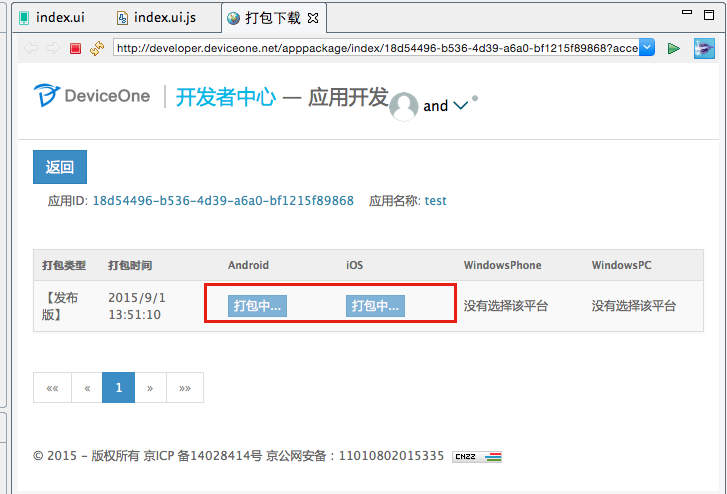
After the application is developed, the program can be packaged into a formal installation package through the cloud packaging service. It has its own icon, name, signature, etc. It can be uploaded to the official Appstore and can be downloaded and used by end users. Just click the "Build Single Version" button in the designer, and finally download the installation package on the download page.
To Be Continue.....

Hot AI Tools

Undresser.AI Undress
AI-powered app for creating realistic nude photos

AI Clothes Remover
Online AI tool for removing clothes from photos.

Undress AI Tool
Undress images for free

Clothoff.io
AI clothes remover

Video Face Swap
Swap faces in any video effortlessly with our completely free AI face swap tool!

Hot Article
Hot Tools

Notepad++7.3.1
Easy-to-use and free code editor

SublimeText3 Chinese version
Chinese version, very easy to use

Zend Studio 13.0.1
Powerful PHP integrated development environment

Dreamweaver CS6
Visual web development tools

SublimeText3 Mac version
God-level code editing software (SublimeText3)
Hot Topics
 1386
1386
 52
52

 Detailed explanation of C++ function debugging: How to debug problems in multi-threaded functions?
May 02, 2024 pm 04:15 PM
Detailed explanation of C++ function debugging: How to debug problems in multi-threaded functions?
May 02, 2024 pm 04:15 PM
C++ multi-thread debugging can use GDB: 1. Enable debugging information compilation; 2. Set breakpoints; 3. Use infothreads to view threads; 4. Use thread to switch threads; 5. Use next, stepi, and locals to debug. Actual case debugging deadlock: 1. Use threadapplyallbt to print the stack; 2. Check the thread status; 3. Single-step the main thread; 4. Use condition variables to coordinate access to solve the deadlock.
 How to use LeakSanitizer to debug C++ memory leaks?
Jun 02, 2024 pm 09:46 PM
How to use LeakSanitizer to debug C++ memory leaks?
Jun 02, 2024 pm 09:46 PM
How to use LeakSanitizer to debug C++ memory leaks? Install LeakSanitizer. Enable LeakSanitizer via compile flag. Run the application and analyze the LeakSanitizer report. Identify memory allocation types and allocation locations. Fix memory leaks and ensure all dynamically allocated memory is released.
 Shortcut to golang function debugging and analysis
May 06, 2024 pm 10:42 PM
Shortcut to golang function debugging and analysis
May 06, 2024 pm 10:42 PM
This article introduces shortcuts for Go function debugging and analysis, including: built-in debugger dlv, which is used to pause execution, check variables, and set breakpoints. Logging, use the log package to record messages and view them during debugging. The performance analysis tool pprof generates call graphs and analyzes performance, and uses gotoolpprof to analyze data. Practical case: Analyze memory leaks through pprof and generate a call graph to display the functions that cause leaks.
 How to do efficient debugging in Java lambda expressions?
Apr 24, 2024 pm 12:03 PM
How to do efficient debugging in Java lambda expressions?
Apr 24, 2024 pm 12:03 PM
Efficiently debug Lambda expressions: IntelliJ IDEA Debugger: Set breakpoints on variable declarations or methods, inspect internal variables and state, and see the actual implementation class. Java9+JVMTI: Connect to the runtime JVM to obtain identifiers, inspect bytecode, set breakpoints, and monitor variables and status during execution.
 How to debug PHP asynchronous code
May 31, 2024 am 09:08 AM
How to debug PHP asynchronous code
May 31, 2024 am 09:08 AM
Tools for debugging PHP asynchronous code include: Psalm: a static analysis tool that can find potential errors. ParallelLint: A tool that inspects asynchronous code and provides recommendations. Xdebug: An extension for debugging PHP applications by enabling a session and stepping through the code. Other tips include using logging, assertions, running code locally, and writing unit tests.
 How to conduct concurrency testing and debugging in Java concurrent programming?
May 09, 2024 am 09:33 AM
How to conduct concurrency testing and debugging in Java concurrent programming?
May 09, 2024 am 09:33 AM
Concurrency testing and debugging Concurrency testing and debugging in Java concurrent programming are crucial and the following techniques are available: Concurrency testing: Unit testing: Isolate and test a single concurrent task. Integration testing: testing the interaction between multiple concurrent tasks. Load testing: Evaluate an application's performance and scalability under heavy load. Concurrency Debugging: Breakpoints: Pause thread execution and inspect variables or execute code. Logging: Record thread events and status. Stack trace: Identify the source of the exception. Visualization tools: Monitor thread activity and resource usage.
 What are the debugging techniques for recursive calls in Java functions?
May 05, 2024 am 10:48 AM
What are the debugging techniques for recursive calls in Java functions?
May 05, 2024 am 10:48 AM
The following techniques are available for debugging recursive functions: Check the stack traceSet debug pointsCheck if the base case is implemented correctlyCount the number of recursive callsVisualize the recursive stack
 PHP Debugging Errors: A Guide to Common Mistakes
Jun 05, 2024 pm 03:18 PM
PHP Debugging Errors: A Guide to Common Mistakes
Jun 05, 2024 pm 03:18 PM
Common PHP debugging errors include: Syntax errors: Check the code syntax to make sure there are no errors. Undefined variable: Before using a variable, make sure it is initialized and assigned a value. Missing semicolons: Add semicolons to all code blocks. Function is undefined: Check that the function name is spelled correctly and make sure the correct file or PHP extension is loaded.
