

Example code for drawing a line chart using html5

This article mainly introduces the example code about using html5 to draw a line chart. It has a certain reference value. Now I share it with you. Friends in need can refer to it
XML/HTML Code Copy content to clipboard
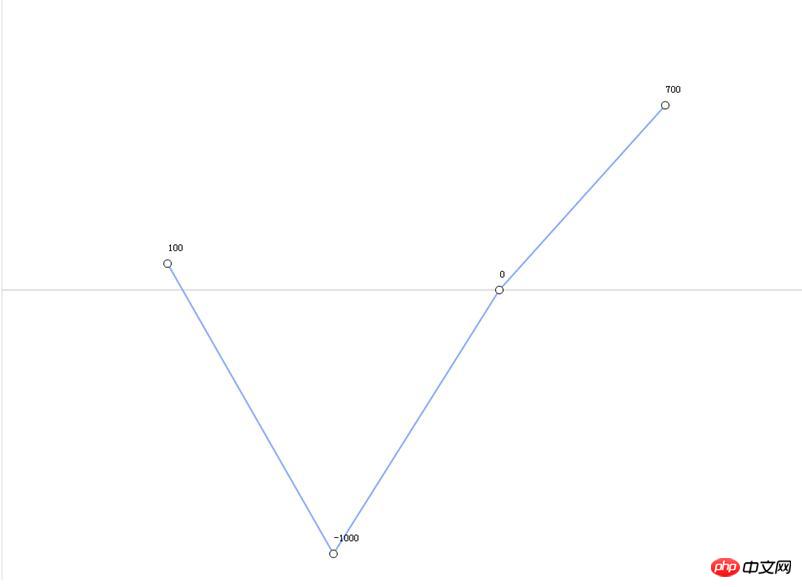
<html> <canvas id="a_canvas" width="1000" height="700"></canvas> <script> (function (){ window.addEventListener("load", function(){ var data = [100,-1000,0,700]; // 获取上下文 var a_canvas = document.getElementById('a_canvas'); var context = a_canvas.getContext("2d"); // 绘制背景 var gradient = context.createLinearGradient(0,0,0,300); // gradient.addColorStop(0,"#e0e0e0"); //gradient.addColorStop(1,"#ffffff"); context.fillStyle = gradient; context.fillRect(0,0,a_canvas.width,a_canvas.height); // 描绘边框 var grid_cols = data.length + 1; var grid_rows = 4; var cell_height = a_canvas.height / grid_rows; var cell_width = a_canvas.width / grid_cols; context.lineWidth = 1; context.strokeStyle = "#a0a0a0"; // 结束边框描绘 context.beginPath(); // 准备画横线 /*for (var col = 0; col <= grid_cols; col++) { var x = col * cell_width; context.moveTo(x,0); context.lineTo(x,a_canvas.height); } // 准备画竖线 for(var row = 0; row <= grid_rows; row++){ var y = row * cell_height; context.moveTo(0,y); context.lineTo(a_canvas.width, y); }*/ //划横线 context.moveTo(0,a_canvas.height/2); context.lineTo(a_canvas.width,a_canvas.height/2); //画竖线 context.moveTo(0,0); context.lineTo(0,a_canvas.height); context.lineWidth = 1; context.strokeStyle = "#c0c0c0"; context.stroke(); var max_v =0; for(var i = 0; i<data.length; i++){ var d=0; if(data[i]<0) {dd=d-data[i]; } else{d=data[i];}; if (d > max_v) { max_v =d}; } max_vmax_v = max_v * 1.1; // 将数据换算为坐标 var points = []; for( var i=0; i < data.length; i++){ var v= data[i]; var px = cell_width * (i +1); var py = a_canvas.height/2 - a_canvas.height*(v / max_v)/2; points.push({"x":px,"y":py}); } // 绘制折现 context.beginPath(); context.moveTo(points[0].x, points[0].y); for(var i= 1; i< points.length; i++){ context.lineTo(points[i].x,points[i].y); } context.lineWidth = 2; context.strokeStyle = "#8BA9FF"; context.stroke(); //绘制坐标图形 for(var i in points){ var p = points[i]; context.beginPath(); context.arc(p.x,p.y,4,0,2*Math.PI); //实心圆 /* context.fillStyle = "#000";*/ //空心圆 context.strokeStyle = "#000"; context.stroke(); context.fillStyle="white"; context.fill(); } //添加文字 for(var i in points) { var p = points[i]; context.beginPath(); context.fillStyle="black"; context.fillText(data[i], p.x + 1, p.y - 15); } },false); })(); </script> </html>Copy after login
The running results are as follows:
Related recommendations:
Drawing circular polygonal patterns based on html5_html5 tutorial skills
##
The above is the detailed content of Example code for drawing a line chart using html5. For more information, please follow other related articles on the PHP Chinese website!

Hot AI Tools

Undresser.AI Undress
AI-powered app for creating realistic nude photos

AI Clothes Remover
Online AI tool for removing clothes from photos.

Undress AI Tool
Undress images for free

Clothoff.io
AI clothes remover

AI Hentai Generator
Generate AI Hentai for free.

Hot Article
Hot Tools

Notepad++7.3.1
Easy-to-use and free code editor

SublimeText3 Chinese version
Chinese version, very easy to use

Zend Studio 13.0.1
Powerful PHP integrated development environment

Dreamweaver CS6
Visual web development tools

SublimeText3 Mac version
God-level code editing software (SublimeText3)
Hot Topics


 Table Border in HTML
Sep 04, 2024 pm 04:49 PM
Table Border in HTML
Sep 04, 2024 pm 04:49 PM
Guide to Table Border in HTML. Here we discuss multiple ways for defining table-border with examples of the Table Border in HTML.
 Nested Table in HTML
Sep 04, 2024 pm 04:49 PM
Nested Table in HTML
Sep 04, 2024 pm 04:49 PM
This is a guide to Nested Table in HTML. Here we discuss how to create a table within the table along with the respective examples.
 HTML margin-left
Sep 04, 2024 pm 04:48 PM
HTML margin-left
Sep 04, 2024 pm 04:48 PM
Guide to HTML margin-left. Here we discuss a brief overview on HTML margin-left and its Examples along with its Code Implementation.
 HTML Table Layout
Sep 04, 2024 pm 04:54 PM
HTML Table Layout
Sep 04, 2024 pm 04:54 PM
Guide to HTML Table Layout. Here we discuss the Values of HTML Table Layout along with the examples and outputs n detail.
 HTML Ordered List
Sep 04, 2024 pm 04:43 PM
HTML Ordered List
Sep 04, 2024 pm 04:43 PM
Guide to the HTML Ordered List. Here we also discuss introduction of HTML Ordered list and types along with their example respectively
 Moving Text in HTML
Sep 04, 2024 pm 04:45 PM
Moving Text in HTML
Sep 04, 2024 pm 04:45 PM
Guide to Moving Text in HTML. Here we discuss an introduction, how marquee tag work with syntax and examples to implement.
 HTML Input Placeholder
Sep 04, 2024 pm 04:54 PM
HTML Input Placeholder
Sep 04, 2024 pm 04:54 PM
Guide to HTML Input Placeholder. Here we discuss the Examples of HTML Input Placeholder along with the codes and outputs.
 HTML onclick Button
Sep 04, 2024 pm 04:49 PM
HTML onclick Button
Sep 04, 2024 pm 04:49 PM
Guide to HTML onclick Button. Here we discuss their introduction, working, examples and onclick Event in various events respectively.
