
 Web Front-end
JS Tutorial
Detailed explanation of the steps to implement a custom multi-y-axis line chart with d3.js
Web Front-end
JS Tutorial
Detailed explanation of the steps to implement a custom multi-y-axis line chart with d3.js
Detailed explanation of the steps to implement a custom multi-y-axis line chart with d3.js
This time I will bring you a detailed explanation of the steps to implement a custom multi-y-axis line chart with d3.js. What are the precautions for d3.js to implement a custom multi-y-axis line chart? Here are the actual cases. , let’s take a look.
Preface
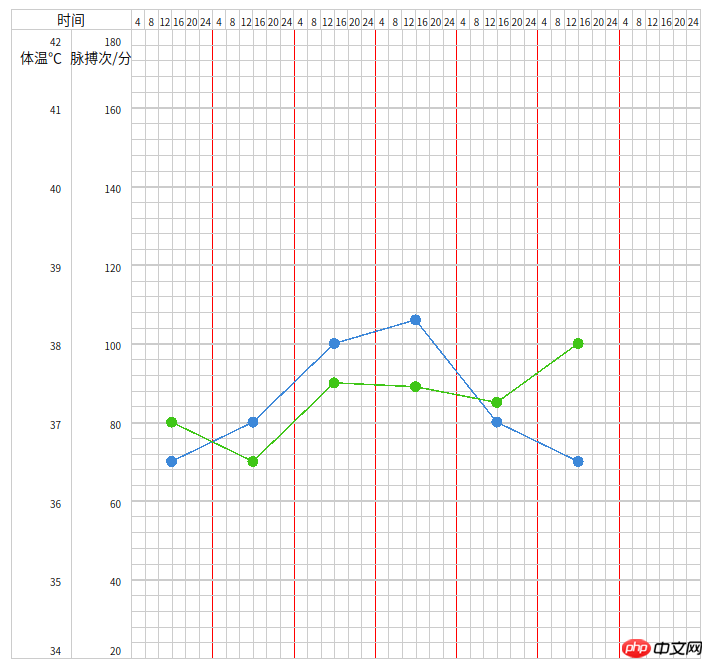
The requirement is to implement a body temperature sheet with vital signs. The x-axis is the timeline, and the y-axis has multiple physical sign items. The effect is not particularly complex, but due to the particularity of the industry, it is not readily available, so d3.js is used to implement a multi-y-axis line chart.
Basics
This picture only uses some of the most basic uses of d3.js, and the amount of data is relatively small, so it cannot be used What an awesome usage, it only involves scale, axis, drawing lines and points, and finally I added a scaling effect.
Effect
Online preview
Detailed implementation
1. Initialize an svg as a container, and then all points, lines and surfaces will be drawn in this container
svg.select('#id')
  .append('svg')
  .attr('width', width)
.attr('height', height)2. Define the scalescale , definition domain domain Displayed scale range, value domainrange Actual data scale
// x轴以时间为刻度
this.x = d3
 .scaleTime()
 .domain([this.beginTime, this.endTime])
 .range([0, this.width]);
// y轴按照像素值为刻度,所有数据需按照比例转换计算
this.y = d3
 .scaleLinear()
 .domain([0, this.height])
 .range([this.height, 0]);
3. Define axis axis , axis needs to be used in conjunction with scale , and is passed in as a parameter axis(scale).
Among them, ticks represents the number of ticks, just pass in the value. Note that ticks will take one of the three numbers 2,5,10 by default , if you pass in another number, it will find a close value based on the actual size (this also involves multiples, please refer to the official API for details);
If you want to customize the scale, you need Use tickValues([NO1,NO2,NO3...]) to achieve; tickSize represents the scale size. Setting it to the width and height of the container svg achieves the full-scale ruler effect.
this.xAxis = d3
 .axisTop(this.x)
 // .ticks(d3.timeHour.every(4))
 .tickValues(d3.timeHour.range(this.beginTime, this.endTime, 4))
 .tickSize(this.height)
 .tickFormat(function (d, i) {
  // return d.getHours();
  return;
 });
this.yAxis = d3
 .axisLeft()
 .scale(this.y)
 .tickValues(d3.range(0, this.height, this.height / 40))
 .tickSize(-this.width)
 .tickFormat(function (d, i) {
  return;
});4. Define the polyline template
// 折线模板
this.line = d3
 .line()
 .x(function (d) {
  return that.x(d.datetime);
 })
 .y(function (d) {
  return that.y(d.svgValue);
});5. The above completes the basic framework of the canvas, and the remaining thing is data rendering.
In this table, the time axis at the top and the y-axis on the left are customized. First, two areas are allocated in the container to draw the axes; then they are implemented in proportion to the width and height of the container.
I believe you have mastered the method after reading the case in this article. For more exciting information, please pay attention to other related articles on the php Chinese website!
Recommended reading:
How to use js to count the number of page tags
JS reflection and dependency injection use case analysis
The above is the detailed content of Detailed explanation of the steps to implement a custom multi-y-axis line chart with d3.js. For more information, please follow other related articles on the PHP Chinese website!

Hot AI Tools

Undresser.AI Undress
AI-powered app for creating realistic nude photos

AI Clothes Remover
Online AI tool for removing clothes from photos.

Undress AI Tool
Undress images for free

Clothoff.io
AI clothes remover

AI Hentai Generator
Generate AI Hentai for free.

Hot Article
Hot Tools

Notepad++7.3.1
Easy-to-use and free code editor

SublimeText3 Chinese version
Chinese version, very easy to use

Zend Studio 13.0.1
Powerful PHP integrated development environment

Dreamweaver CS6
Visual web development tools

SublimeText3 Mac version
God-level code editing software (SublimeText3)
Hot Topics
 1378
1378
 52
52

 How to quickly set up a custom avatar in Netflix
Feb 19, 2024 pm 06:33 PM
How to quickly set up a custom avatar in Netflix
Feb 19, 2024 pm 06:33 PM
An avatar on Netflix is a visual representation of your streaming identity. Users can go beyond the default avatar to express their personality. Continue reading this article to learn how to set a custom profile picture in the Netflix app. How to quickly set a custom avatar in Netflix In Netflix, there is no built-in feature to set a profile picture. However, you can do this by installing the Netflix extension on your browser. First, install a custom profile picture for the Netflix extension on your browser. You can buy it in the Chrome store. After installing the extension, open Netflix on your browser and log into your account. Navigate to your profile in the upper right corner and click
 How to implement an online speech recognition system using WebSocket and JavaScript
Dec 17, 2023 pm 02:54 PM
How to implement an online speech recognition system using WebSocket and JavaScript
Dec 17, 2023 pm 02:54 PM
How to use WebSocket and JavaScript to implement an online speech recognition system Introduction: With the continuous development of technology, speech recognition technology has become an important part of the field of artificial intelligence. The online speech recognition system based on WebSocket and JavaScript has the characteristics of low latency, real-time and cross-platform, and has become a widely used solution. This article will introduce how to use WebSocket and JavaScript to implement an online speech recognition system.
 How to customize shortcut key settings in Eclipse
Jan 28, 2024 am 10:01 AM
How to customize shortcut key settings in Eclipse
Jan 28, 2024 am 10:01 AM
How to customize shortcut key settings in Eclipse? As a developer, mastering shortcut keys is one of the keys to improving efficiency when coding in Eclipse. As a powerful integrated development environment, Eclipse not only provides many default shortcut keys, but also allows users to customize them according to their own preferences. This article will introduce how to customize shortcut key settings in Eclipse and give specific code examples. Open Eclipse First, open Eclipse and enter
 WebSocket and JavaScript: key technologies for implementing real-time monitoring systems
Dec 17, 2023 pm 05:30 PM
WebSocket and JavaScript: key technologies for implementing real-time monitoring systems
Dec 17, 2023 pm 05:30 PM
WebSocket and JavaScript: Key technologies for realizing real-time monitoring systems Introduction: With the rapid development of Internet technology, real-time monitoring systems have been widely used in various fields. One of the key technologies to achieve real-time monitoring is the combination of WebSocket and JavaScript. This article will introduce the application of WebSocket and JavaScript in real-time monitoring systems, give code examples, and explain their implementation principles in detail. 1. WebSocket technology
 How to use JavaScript and WebSocket to implement a real-time online ordering system
Dec 17, 2023 pm 12:09 PM
How to use JavaScript and WebSocket to implement a real-time online ordering system
Dec 17, 2023 pm 12:09 PM
Introduction to how to use JavaScript and WebSocket to implement a real-time online ordering system: With the popularity of the Internet and the advancement of technology, more and more restaurants have begun to provide online ordering services. In order to implement a real-time online ordering system, we can use JavaScript and WebSocket technology. WebSocket is a full-duplex communication protocol based on the TCP protocol, which can realize real-time two-way communication between the client and the server. In the real-time online ordering system, when the user selects dishes and places an order
 The operation process of edius custom screen layout
Mar 27, 2024 pm 06:50 PM
The operation process of edius custom screen layout
Mar 27, 2024 pm 06:50 PM
1. The picture below is the default screen layout of edius. The default EDIUS window layout is a horizontal layout. Therefore, in a single-monitor environment, many windows overlap and the preview window is in single-window mode. 2. You can enable [Dual Window Mode] through the [View] menu bar to make the preview window display the playback window and recording window at the same time. 3. You can restore the default screen layout through [View menu bar>Window Layout>General]. In addition, you can also customize the layout that suits you and save it as a commonly used screen layout: drag the window to a layout that suits you, then click [View > Window Layout > Save Current Layout > New], and in the pop-up [Save Current Layout] Layout] enter the layout name in the small window and click OK
 How to implement an online reservation system using WebSocket and JavaScript
Dec 17, 2023 am 09:39 AM
How to implement an online reservation system using WebSocket and JavaScript
Dec 17, 2023 am 09:39 AM
How to use WebSocket and JavaScript to implement an online reservation system. In today's digital era, more and more businesses and services need to provide online reservation functions. It is crucial to implement an efficient and real-time online reservation system. This article will introduce how to use WebSocket and JavaScript to implement an online reservation system, and provide specific code examples. 1. What is WebSocket? WebSocket is a full-duplex method on a single TCP connection.
 How to customize x-axis and y-axis in excel? (How to customize excel axis scale)
Mar 14, 2024 pm 02:10 PM
How to customize x-axis and y-axis in excel? (How to customize excel axis scale)
Mar 14, 2024 pm 02:10 PM
In an excel table, sometimes you may need to insert coordinate axes to see the changing trend of the data more intuitively. Some friends still don’t know how to insert coordinate axes in the table. Next, I will share with you how to customize the coordinate axis scale in Excel. Coordinate axis insertion method: 1. In the excel interface, select the data. 2. In the insertion interface, click to insert a column chart or bar chart. 3. In the expanded interface, select the graphic type. 4. In the right-click interface of the table, click Select Data. 5. In the expanded interface, you can customize it.
