This time I will show you how to use d3.js in the Vue project. What are the precautions for using d3.js in the Vue project? The following is a practical case, let's take a look.
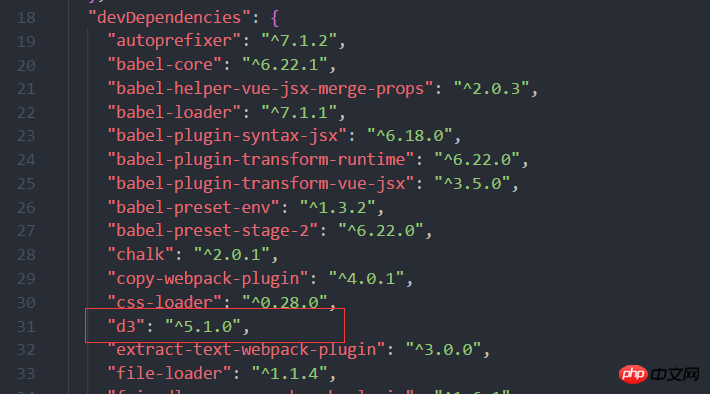
Before I wrote a Demo, some things needed to use d3 to achieve some effects, but I couldn’t find a way to use D3.js in Vue when looking for resources in many forums. D3 on npm can be said to be relatively It’s very inhumane and didn’t say anything about how to use D3.js on webpackFinally, after struggling for a long time, I saw a foreign boss look at his case and successfully implement the use of D3 in the Vue projectFirstnpm install d3 --save-dev

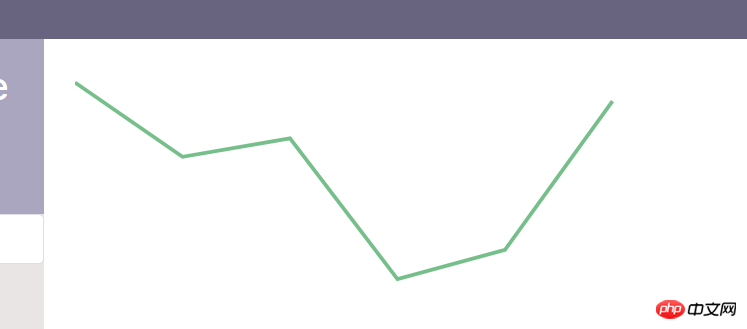
DOM manipulationRenders a simple line chart:
<script>
import * as d3 from 'd3';
const data = [99, 71, 78, 25, 36, 92];
export default {
 name: 'non-vue-line-chart',
 template: '<p></p>',
 mounted() {
  const svg = d3.select(this.$el)
   .append('svg')
   .attr('width', 500)
   .attr('height', 270)
   .append('g')
   .attr('transform', 'translate(0, 10)');
  const x = d3.scaleLinear().range([0, 430]);
  const y = d3.scaleLinear().range([210, 0]);
  d3.axisLeft().scale(x);
  d3.axisTop().scale(y);
  x.domain(d3.extent(data, (d, i) => i));
  y.domain([0, d3.max(data, d => d)]);
  const createPath = d3.line()
   .x((d, i) => x(i))
   .y(d => y(d));
  svg.append('path').attr('d', createPath(data));
 },
};
</script>
<style lang="sass">
svg
 margin: 25px;
 path
  fill: none
  stroke: #76BF8A
  stroke-width: 3px
</style>
<template>
 <svg width="500" height="270">
  <g style="transform: translate(0, 10px)">
   <path :d="line" />
  </g>
 </svg>
</template>
<script>
import * as d3 from 'd3';
export default {
 name: 'vue-line-chart',
 data() {
  return {
   data: [99, 71, 78, 25, 36, 92],
   line: '',
  };
 },
 mounted() {
  this.calculatePath();
 },
 methods: {
  getScales() {
   const x = d3.scaleTime().range([0, 430]);
   const y = d3.scaleLinear().range([210, 0]);
   d3.axisLeft().scale(x);
   d3.axisBottom().scale(y);
   x.domain(d3.extent(this.data, (d, i) => i));
   y.domain([0, d3.max(this.data, d => d)]);
   return { x, y };
  },
  calculatePath() {
   const scale = this.getScales();
   const path = d3.line()
    .x((d, i) => scale.x(i))
    .y(d => scale.y(d));
   this.line = path(this.data);
  },
 },
};
</script>
<style lang="sass" scoped>
svg
 margin: 25px;
path
 fill: none
 stroke: #76BF8A
 stroke-width: 3px
</style>object, the phenomenon is the same as the picture above.
I believe you have mastered the method after reading the case in this article. For more exciting information, please pay attention to other related articles on the php Chinese website! Recommended reading:How to use Vux in a Vue project
Opening and closing the menu without JS
The above is the detailed content of How to use d3.js in a Vue project. For more information, please follow other related articles on the PHP Chinese website!


