
 Web Front-end
JS Tutorial
How to use echarts to display dynamic data on nodes and add prompt text
Web Front-end
JS Tutorial
How to use echarts to display dynamic data on nodes and add prompt text
How to use echarts to display dynamic data on nodes and add prompt text
This time I will show you how to use echarts to display dynamic data and add prompt text on nodes. What are the precautions on how to use echarts to display dynamic data and add prompt text on nodes. The following is a practical case. Let’s take a look.
1. Each node displays dynamic data. This can actually be completed through configuration items. In seriesData binding, it can be completed using the label formatting in the original configuration item itemStyle. As follows:

The code is as follows. If you need to modify the text display style, you need to configure additional items (such as font-style, font-weigth, etc.) Complete
{
      name: '其中:少数民族',
      type: 'line',
      data: ssmz,
      markPoint : {
        data : [
          {type : 'max', name: '最大值'},
          {type : 'min', name: '最小值'}
        ]
      },
      itemStyle: {//节点数据显示
        normal: {
          label: {
            show: true,
            position: 'right',
            formatter: ssmz,//该值动态显示数据,若需固定的文本,则直接写入
          }
        }
      }
},2. Some customers will put forward other requirements. While the polyline displays the highest value and the lowest value, the meaning of the polyline needs to be added to the end of the polyline. This can also be done through itemStyle, but When formatter formats text prompts, you need to write a function yourself to perform formatting judgment and then display
.
The code is as follows:
{
      name: '合计',
      type: 'line',
      data: hj,
      markPoint : {
        data : [
          {type : 'max', name: '最大值'},
          {type : 'min', name: '最小值'}
        ],
      },
      itemStyle: {
        normal: {
          label: {
            show: true,
            position: 'right',//居右
            offset:[20,0],//横向往右20
            formatter: function(para){//格式化提示文本
            if(para.value == hj[hj.length-1]){
            return '合计';//显示文本
            }else{
            return '';
            }
            }
          }
        }
      }
},I believe you have read the case in this article After mastering the method, please pay attention to other related articles on the php Chinese website for more exciting content!
Recommended reading:
How to use Vue to implement a countdown button
How to use Vue to write a two-way data binding
The above is the detailed content of How to use echarts to display dynamic data on nodes and add prompt text. For more information, please follow other related articles on the PHP Chinese website!

Hot AI Tools

Undresser.AI Undress
AI-powered app for creating realistic nude photos

AI Clothes Remover
Online AI tool for removing clothes from photos.

Undress AI Tool
Undress images for free

Clothoff.io
AI clothes remover

AI Hentai Generator
Generate AI Hentai for free.

Hot Article
Hot Tools

Notepad++7.3.1
Easy-to-use and free code editor

SublimeText3 Chinese version
Chinese version, very easy to use

Zend Studio 13.0.1
Powerful PHP integrated development environment

Dreamweaver CS6
Visual web development tools

SublimeText3 Mac version
God-level code editing software (SublimeText3)
Hot Topics
 1378
1378
 52
52

 Reasons and solutions for desktop layout being locked
Feb 19, 2024 pm 06:08 PM
Reasons and solutions for desktop layout being locked
Feb 19, 2024 pm 06:08 PM
What happens when the desktop layout is locked? When using the computer, sometimes we may encounter the situation where the desktop layout is locked. This problem means that we cannot freely adjust the position of desktop icons or change the desktop background. So, what exactly is going on when it says that the desktop layout is locked? 1. Understand the desktop layout and locking functions. First, we need to understand the two concepts of desktop layout and desktop locking. Desktop layout refers to the arrangement of various elements on the desktop, including shortcuts, folders, widgets, etc. we can be free
 How to use map heat map to display city heat in ECharts
Dec 18, 2023 pm 04:00 PM
How to use map heat map to display city heat in ECharts
Dec 18, 2023 pm 04:00 PM
How to use a map heat map to display city heat in ECharts ECharts is a powerful visual chart library that provides various chart types for developers to use, including map heat maps. Map heat maps can be used to show the popularity of cities or regions, helping us quickly understand the popularity or density of different places. This article will introduce how to use the map heat map in ECharts to display city heat, and provide code examples for reference. First, we need a map file containing geographic information, EC
 How to make a remote desktop connection display the other party's taskbar
Jan 03, 2024 pm 12:49 PM
How to make a remote desktop connection display the other party's taskbar
Jan 03, 2024 pm 12:49 PM
There are many users using Remote Desktop Connection. Many users will encounter some minor problems when using it, such as the other party's taskbar not being displayed. In fact, it is probably a problem with the other party's settings. Let's take a look at the solutions below. How to display the other party's taskbar during Remote Desktop Connection: 1. First, click "Settings". 2. Then open "Personalization". 3. Then select "Taskbar" on the left. 4. Turn off the Hide Taskbar option in the picture.
 How to use ECharts and php interface to generate statistical charts
Dec 18, 2023 pm 01:47 PM
How to use ECharts and php interface to generate statistical charts
Dec 18, 2023 pm 01:47 PM
How to use ECharts and PHP interfaces to generate statistical charts Introduction: In modern web application development, data visualization is a very important link, which can help us display and analyze data intuitively. ECharts is a powerful open source JavaScript chart library. It provides a variety of chart types and rich interactive functions, and can easily generate various statistical charts. This article will introduce how to use ECharts and PHP interfaces to generate statistical charts, and give specific code examples. 1. Overview of ECha
 How to display the wifi password QR code? It is recommended to scan the wifi password on WeChat in 3 seconds.
Feb 20, 2024 pm 01:42 PM
How to display the wifi password QR code? It is recommended to scan the wifi password on WeChat in 3 seconds.
Feb 20, 2024 pm 01:42 PM
You don’t need to enter the WIFI password often, so it’s normal to forget it. Today I will teach you the simplest way to find the password of your own WIFI. It can be done in 3 seconds. To check the WIFI password, use WeChat to scan it. The premise of this method is: there must be a mobile phone that can connect to WIFI. Okay, let’s start the tutorial: Step 1. We enter the phone, pull down from the top of the phone, bring up the status bar, and the WIFI icon. Step 2. Long press the WIFI icon to enter the WLAN settings; long press the WIFI icon. Step 3. Click Connected. Enter the WIFI name of your home, click Share Password, and a QR code will pop up; Step 4 of sharing WIFI password, we take a screenshot and save this QR code; Step 5, long press the WeChat icon on the desktop, and click Scan
 How to check the current directory in Linux?
Feb 23, 2024 pm 05:54 PM
How to check the current directory in Linux?
Feb 23, 2024 pm 05:54 PM
In Linux systems, you can use the pwd command to display the current path. The pwd command is the abbreviation of PrintWorkingDirectory and is used to display the path of the current working directory. Enter the following command in the terminal to display the current path: pwd After executing this command, the terminal will display the full path of the current working directory, such as: /home/user/Documents. In addition, you can use some other options to enhance the functionality of the pwd command. For example, the -P option can display
 Does ECharts depend on jQuery? In-depth analysis
Feb 27, 2024 am 08:39 AM
Does ECharts depend on jQuery? In-depth analysis
Feb 27, 2024 am 08:39 AM
Does ECharts need to rely on jQuery? Detailed interpretation requires specific code examples. ECharts is an excellent data visualization library that provides a rich range of chart types and interactive functions and is widely used in web development. When using ECharts, many people will have a question: Does ECharts need to rely on jQuery? This article will explain this in detail and give specific code examples. First, to be clear, ECharts itself does not rely on jQuery;
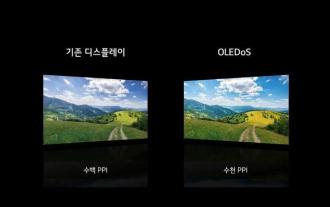 Samsung will provide displays for Microsoft's MR headsets, and the devices are expected to be lighter and have clearer displays
Aug 10, 2024 pm 09:45 PM
Samsung will provide displays for Microsoft's MR headsets, and the devices are expected to be lighter and have clearer displays
Aug 10, 2024 pm 09:45 PM
Recently, Samsung Display and Microsoft signed an important cooperation agreement. According to the agreement, Samsung Display will develop and supply hundreds of thousands of OLEDoS panels for mixed reality (MR) head-mounted devices to Microsoft. Microsoft is developing an MR device for multimedia content such as games and movies. This device is expected to It will be launched after the OLEDoS specifications are finalized, mainly serving the commercial field, and is expected to be delivered as early as 2026. OLEDoS (OLED on Silicon) technology OLEDoS is a new display technology that deposits OLED on a silicon substrate. Compared with traditional glass substrates, it is thinner and has higher pixels. OLEDoS display and ordinary display
