

How to create a logistics map in D3.js (detailed tutorial)
This article mainly introduces the sample code for using D3.js to create a logistics map. Now I share it with you and give it as a reference.
This article introduces the sample code for creating a logistics map using D3.js and shares it with everyone. The details are as follows:
Sample map
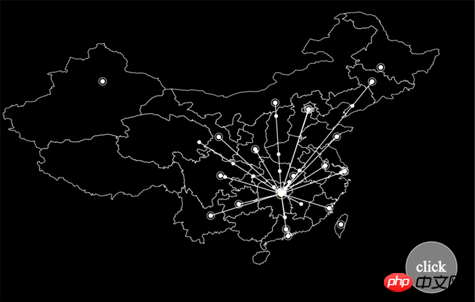
Production Ideas
#You need to draw a map of China as the background.
The latitude and longitude coordinates of major cities are required to draw the starting and ending points of road sheets.
The city that receives the logistics order draws a flashing mark.
The target city that already has a logistics order will no longer draw a route.
Every time a new logistics order is generated, there will be an animation effect of the mark moving along the route to the target.
The data after drawing needs to be cleaned up to reduce the resource usage of the browser.
Start coding
1. Create a web page template
Load D3JS for easy debugging , directly download the d3.js file locally. When actually using it, you can change it to the loading path. Note that the V4 version of D3 is used, which is different from the V3 version.
Create a p block and prepare it for drawing.
<!DOCTYPE html>
<html lang="en">
  <head>
    <meta charset="utf8">
    <script type="text/javascript" src="../../static/d3/d3.js"></script>
    <title>地图</title>
  </head>
  <body>
    <p class="fxmap">
    </p>
  </body>
  <script type="text/javascript"></script>
</html>Create SVG, all the following codes are placed in <script></script>
var width=1000 , height=800; // 定义SVG宽高
var svg = d3.select("body p.fxmap")
            .append("svg")
            .attr("width", "width)
            .attr("height", height)
.style("background","#000"); //Create SVG graphics grouping in preparation for calling
gmp, save the background map and starting point marker.
mline, saves the connection between the starting point and the target, as well as the target point.
button, button for testing
gmap = svg.append("g").attr("id", "map").attr("stroke", "white").attr("stroke-width",1);
    mline = svg.append("g").attr("id", "moveto").attr("stroke", "#FFF").attr("stroke-width", 1.5).attr("fill","#FFF");
button = svg.append("g").attr("id", "button").attr("stroke", "white").attr("stroke-width", 1).attr("fill", "white");Create projection function
Longitude and latitude cannot be used directly for drawing and need to be converted into plane coordinates. d3js provides a relatively rich range of projection methods. In this example, the geoEquirectangular() method is used.
projection is a method to convert longitude and latitude into plane coordinates
path is a method to convert longitude and latitude into line drawing point coordinates (save yourself Then write the function to construct the path path)
var projection = d3.geoEquirectangular()
              .center([465,395]) // 指定投影中心,注意[]中的是经纬度
              .scale(height)
              .translate([width / 2, height / 2]);
var path = d3.geoPath().projection(projection);Create a marker so that multiple connection endpoints can be called
Because There will be multiple end points of the logistics line, so they are all called in a marker.
This mark is composed of a circular outer ring in the middle. The flashing effect of the outer ring is created separately.
marker = svg.append("defs")
          .append("marker")
          .append("marker")
          .attr("id", "pointer")
          .attr("viewBox","0 0 12 12")  // 可见范围
          .attr("markerWidth","12")    // 标记宽度
          .attr("markerHeight","12")    // 标记高度
          .attr("orient", "auto")     //
          .attr("markerUnits", "strokeWidth") // 随连接线宽度进行缩放
          .attr("refX", "6")       // 连接点坐标
          .attr("refY", "6")
    // 绘制标记中心圆
    marker.append("circle")
        .attr("cx", "6")
        .attr("cy", "6")
        .attr("r", "3")
        .attr("fill", "white");
    // 绘制标记外圆,之后在timer()中添加闪烁效果
    marker.append("circle")
        .attr("id", "markerC")
        .attr("cx", "6")
        .attr("cy", "6")
        .attr("r", "5")
        .attr("fill-opacity", "0")
        .attr("stroke-width", "1")
.attr("stroke", "white");Draw a map of China and mark the starting point (Changsha)
The longitude and latitude set used in the map is china.json. There are many files on the Internet
// 记录长沙坐标
    var changsha = projection([112.59,28.12]);
    // 读取地图数据,并绘制中国地图
    mapdata = [];
    d3.json('china.json', function(error, data){
      if (error)
        console.log(error);
      // 读取地图数据
      mapdata = data.features;
      // 绘制地图
      gmap.selectAll("path")
        .data(mapdata)
        .enter()
        .append("path")
        .attr("d", path);
      // 标记长沙
      gmap.append("circle").attr("id","changsha")
        .attr("cx", changsha[0])
        .attr("cy", changsha[1])
        .attr("r", "6")
        .attr("fill", "yellow")
      gmap.append("circle").attr("id","changshaC")
        .attr("cx", changsha[0])
        .attr("cy", changsha[1])
        .attr("r", "10")
        .attr("stroke-width", "2")
        .attr("fill-opacity", "0");
});Create a method to draw a line from the specified starting point to the end point, and draw markers at the network points.
The method requires inputting the destination city name (city) and latitude and longitude (data)
Call the previously established project() method. Convert the end point latitude and longitude into plane coordinates.
Calculate the distance between the starting point (Changsha) and the end point as line length and animation time parameters.
Draw a circular mark on the line and animate the movement from the starting point to the end point.
After the mark is moved to the end point, it will be deleted to save resources.
If the line point has been drawn before, no line will be drawn, only the moving mark will be drawn.
Every time a logistics order is processed, the city record is 1.
// 创建对象,保存每个城市的物流记录数量
    var citylist = new Object();
    // 创建方法,输入data坐标,绘制发射线
    var moveto = function(city, data){
      var pf = {x:projection([112.59,28.12])[0], y:projection([112.59,28.12])[1]};
      var pt = {x:projection(data)[0], y:projection(data)[1]};
      var distance = Math.sqrt((pt.x - pf.x)**2 + (pt.y - pf.y)**2);
      if (city in citylist){
        citylist[city]++;
      }else{
        mline.append("line")
            .attr("x1", pf.x)
            .attr("y1", pf.y)
            .attr("x2", pt.x)
            .attr("y2", pt.y)
            .attr("marker-end","url(#pointer)")
            .style("stroke-dasharray", " "+distance+", "+distance+" ")
            .transition()
            .duration(distance*30)
            .styleTween("stroke-dashoffset", function(){
              return d3.interpolateNumber(distance, 0);
            });
        citylist[city] = 1;
      };
      mline.append("circle")
        .attr("cx", pf.x)
        .attr("cy", pf.y)
        .attr("r", 3)
        .transition()
        .duration(distance*30)
        .attr("transform", "translate("+(pt.x-pf.x)+","+(pt.y-pf.y)+")")
        .remove();
};Create an animation queue example to achieve the flashing effect of the outer circle of the mark
var scale = d3.scaleLinear();
    scale.domain([0, 1000, 2000])
      .range([0, 1, 0]);
    var start = Date.now();
    d3.timer(function(){
      var s1 = scale((Date.now() - start)%2000);
      // console.log(s1);
      gmap.select("circle#changshaC")
        .attr("stroke-opacity", s1);
      marker.select("circle#markerC")
        .attr("stroke-opacity", s1);
});Create a test button and test target city data
var cityordinate = {
      '哈尔滨':[126.5416150000,45.8088260000],
      '石家庄':[116.46,39.92],
      '北京':[116.39564503787867,39.92998577808024],
      '上海':[121.480539,31.235929],
      '广州':[113.271431,23.135336],
      '重庆':[106.558434,29.568996],
      '青岛':[120.38442818368189,36.10521490127382],
      '福州':[119.30347,26.080429],
      '兰州':[103.840521,36.067235],
      '贵阳':[106.636577,26.653325],
      '成都':[104.081534,30.655822],
      '西安':[108.946466,34.347269],
      '长春':[125.3306020000,43.8219540000],
      '台湾':[120.961454,23.80406],
      '呼和浩特':[111.7555090000,40.8484230000],
      '澳门':[113.5494640000,22.1929190000],
      '武汉':[114.3115820000,30.5984670000],
      '昆明':[102.71460113878045,25.049153100453159],
      '乌鲁木齐':[87.56498774111579,43.84038034721766],
      '益阳':[112.36654664522563,28.58808777988717],
      '南京':[118.77807440802562,32.05723550180587],
      '武昌':[114.35362228468498,30.56486029278519],
    };

    // 随机获得目标城市
    var cityname = [], total = 0;
    for (var key in cityordinate){
      cityname[total++] = key;
    };

    // 创建操作按钮,每次点击发射一条物流线
    button.append("circle")
        .attr("cx", width*0.9)
        .attr("cy", height*0.8)
        .attr("r", width/20)
        .attr("text","click")
        .attr("fill", "grey");
    button.append("text")
        .attr("x", width*0.87)
        .attr("y", height*0.81)
        .style("font-size", "30px")
        .text("click");
    button.on("click", function(){
      var _index = ~~(Math.random() * total);
      moveto(cityname[_index], cityordinate[cityname[_index]]);
});The above is I compiled it for everyone, I hope it will be helpful to everyone in the future.
Related articles:
How to implement map grid using Baidu Maps
Comparison and distinction between Express and Koa2 in nodejs (detailed tutorial)
The singleton mode in JS implements data addition, deletion, modification and query
The above is the detailed content of How to create a logistics map in D3.js (detailed tutorial). For more information, please follow other related articles on the PHP Chinese website!

Hot AI Tools

Undresser.AI Undress
AI-powered app for creating realistic nude photos

AI Clothes Remover
Online AI tool for removing clothes from photos.

Undress AI Tool
Undress images for free

Clothoff.io
AI clothes remover

AI Hentai Generator
Generate AI Hentai for free.

Hot Article
Hot Tools

Notepad++7.3.1
Easy-to-use and free code editor

SublimeText3 Chinese version
Chinese version, very easy to use

Zend Studio 13.0.1
Powerful PHP integrated development environment

Dreamweaver CS6
Visual web development tools

SublimeText3 Mac version
God-level code editing software (SublimeText3)
Hot Topics
 1371
1371
 52
52

 How to make Google Maps the default map in iPhone
Apr 17, 2024 pm 07:34 PM
How to make Google Maps the default map in iPhone
Apr 17, 2024 pm 07:34 PM
The default map on the iPhone is Maps, Apple's proprietary geolocation provider. Although the map is getting better, it doesn't work well outside the United States. It has nothing to offer compared to Google Maps. In this article, we discuss the feasible steps to use Google Maps to become the default map on your iPhone. How to Make Google Maps the Default Map in iPhone Setting Google Maps as the default map app on your phone is easier than you think. Follow the steps below – Prerequisite steps – You must have Gmail installed on your phone. Step 1 – Open the AppStore. Step 2 – Search for “Gmail”. Step 3 – Click next to Gmail app
 How to use map and location functions in uniapp
Oct 16, 2023 am 08:01 AM
How to use map and location functions in uniapp
Oct 16, 2023 am 08:01 AM
How to use map and positioning functions in uniapp 1. Background introduction With the popularity of mobile applications and the rapid development of positioning technology, map and positioning functions have become an indispensable part of modern mobile applications. uniapp is a cross-platform application development framework developed based on Vue.js, which can facilitate developers to share code on multiple platforms. This article will introduce how to use maps and positioning functions in uniapp and provide specific code examples. 2. Use the uniapp-amap component to implement the map function
 How to add store address to Xiaohongshu map? How to fill in the store address setting?
Mar 29, 2024 am 09:41 AM
How to add store address to Xiaohongshu map? How to fill in the store address setting?
Mar 29, 2024 am 09:41 AM
As Xiaohongshu becomes more and more popular among young people, more and more people choose to open stores on Xiaohongshu. Many novice sellers encounter difficulties when setting up their store address and do not know how to add the store address to the map. 1. How to add the store address to the map in Xiaohongshu? 1. First, make sure your store has a registered account on Xiaohongshu and has successfully opened a store. 2. Log in to your Xiaohongshu account, enter the store backend, and find the "Store Settings" option. 3. On the store settings page, find the "Store Address" column and click "Add Address". 4. In the address adding page that pops up, fill in the detailed address information of the store, including province, city, district, county, street, house number, etc. 5. After filling in, click the "Confirm Add" button. Xiaohongshu will provide you with the address
 How to create a map heat map using Highcharts
Dec 17, 2023 pm 04:06 PM
How to create a map heat map using Highcharts
Dec 17, 2023 pm 04:06 PM
How to use Highcharts to create a map heat map requires specific code examples. A heat map is a visual data display method that can represent the data distribution in each area through different color shades. In the field of data visualization, Highcharts is a very popular JavaScript library that provides rich chart types and interactive functions. This article will introduce how to use Highcharts to create a map heat map and provide specific code examples. First, we need to prepare some data
 How to use at-a-glance directions on Google Maps
Jun 13, 2024 pm 09:40 PM
How to use at-a-glance directions on Google Maps
Jun 13, 2024 pm 09:40 PM
A year after its launch, Google Maps has launched a new feature. Once you set a route to your destination on the map, it summarizes your travel route. Once your journey begins, you can "Browse" route guidance from your phone's lock screen. You can use Google Maps to see your estimated arrival time and route. Throughout your trip, you can view navigation information on your lock screen, and by unlocking your phone, you can view navigation information without accessing Google Maps. By unlocking your phone, you can view navigation information without accessing Google Maps. By unlocking your phone, you can view navigation information without accessing Google Maps. By unlocking your phone, you can view navigation information without accessing Google Maps. By unlocking your phone, you can view navigation information without accessing Google Maps. By unlocking your phone, you can view navigation information without accessing Google Maps.
 Master the art of using Apple Maps Guides on iPhone and iPad
Aug 30, 2023 am 09:25 AM
Master the art of using Apple Maps Guides on iPhone and iPad
Aug 30, 2023 am 09:25 AM
In an ever-evolving technological world, the ability to navigate digital maps has become an essential skill. This article provides a comprehensive guide on how to use Apple Maps Guides on iPhone and iPad, a feature that revolutionizes the way users explore their surroundings and plan their journeys. Apple Maps is a built-in application on all Apple devices, and it is constantly updated and improved to provide a seamless navigation experience. One of its most notable features is the Guide feature, which provides a curated list of interesting places to visit in various cities around the world. This feature is not only beneficial for travelers, but also a boon for locals looking to discover new attractions in their city. How to use Apple Maps on iOS guide First, visit the Apple Maps
 Cloud-based and car-based MapNeXt is all done! Construction of next-generation online high-precision maps
Jan 31, 2024 pm 06:06 PM
Cloud-based and car-based MapNeXt is all done! Construction of next-generation online high-precision maps
Jan 31, 2024 pm 06:06 PM
Written above & the author’s personal understanding In collaborative, connected and automated mobility (CCAM), the stronger the ability of intelligent driving vehicles to perceive, model and analyze the surrounding environment, the more aware and able they are to understand and make decisions , as well as perform complex driving scenarios safely and efficiently. High-precision (HD) maps represent road environments with centimeter-level accuracy and lane-level semantic information, making them a core component of intelligent mobility systems and a key enabler of CCAM technology. These maps provide automated vehicles with a powerful advantage in understanding their surroundings. HD maps are also considered hidden or virtual sensors because they bring together knowledge from physical sensors (maps), namely lidar, cameras, GPS and IMU, to build a model of the road environment. HD map
 Which country is the Gaode map from?
Jul 28, 2023 pm 02:26 PM
Which country is the Gaode map from?
Jul 28, 2023 pm 02:26 PM
Amap is Chinese and was acquired by Alibaba in 2014. Alibaba is a Chinese company, and its wholly-owned acquisition of Amap means that Amap still belongs to China. In April 2014, AutoNavi officially reached a merger and acquisition agreement with Alibaba Group. Alibaba acquired the remaining 72% of AutoNavi's shares at a price higher than the market price. It is China's leading provider of digital map content, navigation and location service solutions. It has Class A surveying and mapping qualifications for navigation electronic maps and Class A surveying and mapping qualifications for Internet map services. Its high-quality electronic map database has become the company's core competitiveness.
