
 Web Front-end
JS Tutorial
How to build a d3 force-directed graph using react (detailed tutorial)
Web Front-end
JS Tutorial
How to build a d3 force-directed graph using react (detailed tutorial)
How to build a d3 force-directed graph using react (detailed tutorial)
This article mainly introduces how to build a d3 force-directed diagram in react. Now I will share it with you and give you a reference.
D3js force-directed graph construction
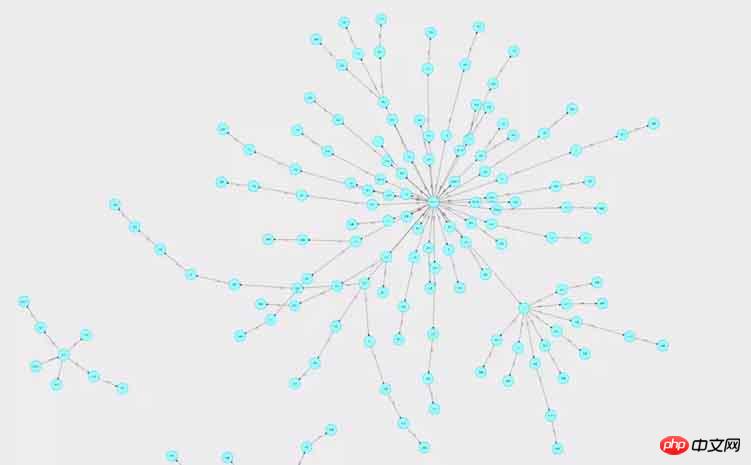
d3js is a JavaScript library that can manipulate documents based on data. Data can be displayed using HTML, CSS, SVG and Canvas. Force-directed graphs can be used to represent many-to-many relationships between nodes.
Achievement effect: The connection line has an arrow. Clicking on a node can change the color of the node and the thickness of the connected line, zoom and drag.
Version: 4.X
Installation and import
npm installation: npm install d3
Front-end import: import * as d3 from 'd3';
1. Complete code
import React, { Component } from 'react';
import PropTypes from 'prop-types';
import { connect } from 'react-redux';
import { push } from 'react-router-redux';
import * as d3 from 'd3';
import { Row, Form } from 'antd';
import { chartReq} from './actionCreator';
import './Chart.less';
const WIDTH = 1900;
const HEIGHT = 580;
const R = 30;
let simulation;
class Chart extends Component {
constructor(props, context) {
super(props, context);
this.print = this.print.bind(this);
this.forceChart = this.forceChart.bind(this);
this.state = {
};
}
componentWillMount() {
this.props.dispatch(push('/Chart'));
}
componentDidMount() {
this.print();
}
print() {
let callback = (res) => { // callback获取后台返回的数据,并存入state
let nodeData = res.data.nodes;
let relationData = res.data.rels;
this.setState({
nodeData: res.data.nodes,
relationData: res.data.rels,
});
let nodes = [];
for (let i = 0; i < nodeData.length; i++) {
nodes.push({
id: (nodeData[i] && nodeData[i].id) || '',
name: (nodeData[i] && nodeData[i].name) || '',
type: (nodeData[i] && nodeData[i].type) || '',
definition: (nodeData[i] && nodeData[i].definition) || '',
});
}
let edges = [];
for (let i = 0; i < relationData.length; i++) {
edges.push({
id: (relationData[i] && (relationData[i].id)) || '',
source: (relationData[i] && relationData[i].start.id) || '',
target: (relationData[i] && relationData[i].end.id) || '',
tag: (relationData[i] && relationData[i].name) || '',
});
}
this.forceChart(nodes, edges); // d3力导向图内容
};
this.props.dispatch(chartReq({ param: param }, callback));
}
// func
forceChart(nodes, edges) {
this.refs['theChart'].innerHTML = '';
// 函数内其余代码请看拆解代码
}
render() {
return (
<Row style={{ minWidth: 900 }}>
<p className="outerp">
<p className="theChart" id="theChart" ref="theChart">
</p>
</p>
</Row>
);
}
}
Chart.propTypes = {
dispatch: PropTypes.func.isRequired,
};
function mapStateToProps(state) {
return {
};
}
const WrappedChart = Form.create({})(Chart);
export default connect(mapStateToProps)(WrappedChart);2. Disassembled code
1. Component
<p className="theChart" id="theChart" ref="theChart"> </p>
The entire picture will be drawn in p.
2. Construct nodes and connections
let nodes = []; // 节点
for (let i = 0; i < nodeData.length; i++) {
nodes.push({
id: (nodeData[i] && nodeData[i].id) || '',
name: (nodeData[i] && nodeData[i].name) || '', // 节点名称
});
}
let edges = []; // 连线
for (let i = 0; i < relationData.length; i++) {
edges.push({
id: (relationData[i] && (relationData[i].id)) || '',
source: (relationData[i] && relationData[i].start.id) || '', // 开始节点
target: (relationData[i] && relationData[i].end.id) || '', // 结束节点
tag: (relationData[i] && relationData[i].name) || '', // 连线名称
});
}The specific structure is based on your project data.
3. Define the force model
const simulation = d3.forceSimulation(nodes) // 指定被引用的nodes数组
  .force('link', d3.forceLink(edges).id(d => d.id).distance(150))
  .force('collision', d3.forceCollide(1).strength(0.1))
  .force('center', d3.forceCenter(WIDTH / 2, HEIGHT / 2))
  .force('charge', d3.forceManyBody().strength(-1000).distanceMax(800));
Set the force through simulation.force(). You can set these types of forces:
Centering: Centering force, set the position of the center point of the graph.
Collision: node collision force, .strength parameter range is [0, 1].
Links: The force of the connection; .distance sets the distance between the nodes at both ends of the connection.
Many-Body: When the .strength parameter is positive, gravity is simulated; when it is negative, charge force is simulated; the .distanceMax parameter sets the maximum distance.
Positioning: Given a force in a certain direction.
Monitor the position changes of audiogram elements through simulation.on.
4. Draw svg
const svg = d3.select('#theChart').append('svg') // 在id为‘theChart'的标签内创建svg
   .style('width', WIDTH)
   .style('height', HEIGHT * 0.9)
   .on('click', () => {
    console.log('click', d3.event.target.tagName);
   })
   .call(zoom); // 缩放
const g = svg.append('g'); // 则svg中创建gCreate svg, create g in svg, and place node connections and other content in g.
select: Select the first corresponding element
selectAll: Select all corresponding elements
append: Create element
5. Draw the connection line
const edgesLine = svg.select('g')
  .selectAll('line')
  .data(edges) // 绑定数据
  .enter() // 添加数据到选择集edgepath
  .append('path') // 生成折线
  .attr('d', (d) => { return d && 'M ' + d.source.x + ' ' + d.source.y + ' L ' + d.target.x + ' ' + d.target.y; }) // 遍历所有数据,d表示当前遍历到的数据,返回绘制的贝塞尔曲线
  .attr('id', (d, i) => { return i && 'edgepath' + i; }) // 设置id,用于连线文字
  .attr('marker-end', 'url(#arrow)') // 根据箭头标记的id号标记箭头
  .style('stroke', '#000') // 颜色
.style('stroke-width', 1); // 粗细The connection line is drawn with Bezier curve: (M starting point X starting point y L End point x End point y)
6. Draw the arrow on the connection
const defs = g.append('defs'); // defs定义可重复使用的元素
const arrowheads = defs.append('marker') // 创建箭头
  .attr('id', 'arrow')
  // .attr('markerUnits', 'strokeWidth') // 设置为strokeWidth箭头会随着线的粗细进行缩放
  .attr('markerUnits', 'userSpaceOnUse') // 设置为userSpaceOnUse箭头不受连接元素的影响
  .attr('class', 'arrowhead')
  .attr('markerWidth', 20) // viewport
  .attr('markerHeight', 20) // viewport
  .attr('viewBox', '0 0 20 20') // viewBox
  .attr('refX', 9.3 + R) // 偏离圆心距离
  .attr('refY', 5) // 偏离圆心距离
  .attr('orient', 'auto'); // 绘制方向,可设定为:auto(自动确认方向)和 角度值
arrowheads.append('path')
  .attr('d', 'M0,0 L0,10 L10,5 z') // d: 路径描述,贝塞尔曲线
  .attr('fill', '#000'); // 填充颜色
viewport: visible area
viewBox: actual size, will automatically scale to fill the viewport
7. Draw nodes
const nodesCircle = svg.select('g')
  .selectAll('circle')
  .data(nodes)
  .enter()
  .append('circle') // 创建圆
  .attr('r', 30) // 半径
  .style('fill', '#9FF') // 填充颜色
  .style('stroke', '#0CF') // 边框颜色
  .style('stroke-width', 2) // 边框粗细
  .on('click', (node) => { // 点击事件
    console.log('click');
  })
.call(drag); // 拖拽单个节点带动整个图Create circles as nodes .
.call() calls the drag function.
8. Node name
const nodesTexts = svg.select('g')
  .selectAll('text')
  .data(nodes)
  .enter()
  .append('text')
  .attr('dy', '.3em') // 偏移量
  .attr('text-anchor', 'middle') // 节点名称放在圆圈中间位置
  .style('fill', 'black') // 颜色
  .style('pointer-events', 'none') // 禁止鼠标事件
  .text((d) => { // 文字内容
    return d && d.name; // 遍历nodes每一项,获取对应的name
});Because the text is on the upper layer of the node, if the mouse event is not disabled, clicking the text will not respond to the effect of clicking the node, nor can it be dragged. node.
9. Connection name
const edgesText = svg.select('g').selectAll('.edgelabel')
  .data(edges)
  .enter()
  .append('text') // 为每一条连线创建文字区域
  .attr('class', 'edgelabel')
  .attr('dx', 80)
  .attr('dy', 0);
edgesText.append('textPath')// 设置文字内容
  .attr('xlink:href', (d, i) => { return i && '#edgepath' + i; }) // 文字布置在对应id的连线上
  .style('pointer-events', 'none')
.text((d) => { return d && d.tag; });10. When the mouse is moved to the node, a bubble prompt appears
nodesCircle.append('title')
  .text((node) => { // .text设置气泡提示内容
    return node.definition;
});11. Monitor the position changes of the picture elements
simulation.on('tick', () => {
  // 更新节点坐标
  nodesCircle.attr('transform', (d) => {
    return d && 'translate(' + d.x + ',' + d.y + ')';
  });
  // 更新节点文字坐标
  nodesTexts.attr('transform', (d) => {
    return 'translate(' + (d.x) + ',' + d.y + ')';
  });
  // 更新连线位置
  edgesLine.attr('d', (d) => {
    const path = 'M ' + d.source.x + ' ' + d.source.y + ' L ' + d.target.x + ' ' + d.target.y;
    return path;
  });
  // 更新连线文字位置
  edgesText.attr('transform', (d, i) => {
    return 'rotate(0)';
  });
});12. Drag
function onDragStart(d) {
  // console.log('start');
  // console.log(d3.event.active);
  if (!d3.event.active) {
  simulation.alphaTarget(1) // 设置衰减系数,对节点位置移动过程的模拟,数值越高移动越快,数值范围[0,1]
   .restart(); // 拖拽节点后,重新启动模拟
  }
  d.fx = d.x;  // d.x是当前位置,d.fx是静止时位置
  d.fy = d.y;
}
function dragging(d) {
  d.fx = d3.event.x;
  d.fy = d3.event.y;
}
function onDragEnd(d) {
  if (!d3.event.active) simulation.alphaTarget(0);
  d.fx = null;    // 解除dragged中固定的坐标
  d.fy = null;
}
const drag = d3.drag()
  .on('start', onDragStart)
  .on('drag', dragging) // 拖拽过程
.on('end', onDragEnd);13. Zoom
function onZoomStart(d) {
  // console.log('start zoom');
}
function zooming(d) {
  // 缩放和拖拽整个g
  // console.log('zoom ing', d3.event.transform, d3.zoomTransform(this));
  g.attr('transform', d3.event.transform); // 获取g的缩放系数和平移的坐标值。
}
function onZoomEnd() {
  // console.log('zoom end');
}
const zoom = d3.zoom()
  // .translateExtent([[0, 0], [WIDTH, HEIGHT]]) // 设置或获取平移区间, 默认为[[-∞, -∞], [+∞, +∞]]
  .scaleExtent([1 / 10, 10]) // 设置最大缩放比例
  .on('start', onZoomStart)
  .on('zoom', zooming)
.on('end', onZoomEnd);3. Other effects
1. When clicking a node, make the connection line thicker
nodesCircle.on('click, (node) => {
  edges_line.style("stroke-width",function(line){
    if(line.source.name==node.name || line.target.name==node.name){
      return 4;
    }else{
      return 0.5;
    }
  });
})2. The clicked node changes color
nodesCircle.on('click, (node) => {
  nodesCircle.style('fill', (nodeOfSelected) => { // nodeOfSelected:所有节点, node: 选中的节点
  if (nodeOfSelected.id === node.id) { // 被点击的节点变色
    console.log('node')
      return '#36F';
    } else {
      return '#9FF';
    }
  });
})4. In react Notes on use
componentDidMount() {
this.print();
}
print() {
let callback = (res) => { // callback获取后台返回的数据,并存入state
let nodeData = res.data.nodes;
let relationData = res.data.rels;
this.setState({
nodeData: res.data.nodes,
relationData: res.data.rels,
});
let nodes = [];
for (let i = 0; i < nodeData.length; i++) {
nodes.push({
id: (nodeData[i] && nodeData[i].id) || '',
name: (nodeData[i] && nodeData[i].name) || '',
type: (nodeData[i] && nodeData[i].type) || '',
definition: (nodeData[i] && nodeData[i].definition) || '',
});
}
let edges = [];
for (let i = 0; i < relationData.length; i++) {
edges.push({
id: (relationData[i] && (relationData[i].id)) || '',
source: (relationData[i] && relationData[i].start.id) || '',
target: (relationData[i] && relationData[i].end.id) || '',
tag: (relationData[i] && relationData[i].name) || '',
});
}
this.forceChart(nodes, edges); // d3力导向图内容
};
this.props.dispatch(getDataFromNeo4J({
neo4jrun: 'match p=(()-[r]-()) return p limit 300',
}, callback));
}Where to construct the graphBecause the graph is dynamic, if it is rendered multiple times (render is executed multiple times and rendered multiple times), it will not overwrite the previous rendering. The picture will be rendered multiple times and multiple pictures will appear. If you put the function print() of the construction diagram into componentDidMount() and execute it, it will only be rendered once.
After adding, deleting, and modifying node and connection data, you need to call the print() function again to reconstruct the graph.
Where to get the data The data is not obtained from redux. The callback obtains it directly after sending the request.
5. Dry information: d3 project search URL
D3js all project search.http://blockbuilder.org/search/
The above is what I compiled for everyone, I hope It will be helpful to everyone in the future.
Related articles:
How to achieve forward refresh and backward non-refresh effect in vue
In Vue2.5 through Table and How does the Pagination component implement the paging function
How to integrate Bootstrap 4 in Laravel?
How to get the option value in the select tag in jquery
How to dynamically add option to select using js (detailed tutorial)
How to achieve seamless scrolling effect using vue.js
The above is the detailed content of How to build a d3 force-directed graph using react (detailed tutorial). For more information, please follow other related articles on the PHP Chinese website!

Hot AI Tools

Undresser.AI Undress
AI-powered app for creating realistic nude photos

AI Clothes Remover
Online AI tool for removing clothes from photos.

Undress AI Tool
Undress images for free

Clothoff.io
AI clothes remover

Video Face Swap
Swap faces in any video effortlessly with our completely free AI face swap tool!

Hot Article
Hot Tools

Notepad++7.3.1
Easy-to-use and free code editor

SublimeText3 Chinese version
Chinese version, very easy to use

Zend Studio 13.0.1
Powerful PHP integrated development environment

Dreamweaver CS6
Visual web development tools

SublimeText3 Mac version
God-level code editing software (SublimeText3)
Hot Topics
 1392
1392
 52
52

 What should I do if I encounter garbled code printing for front-end thermal paper receipts?
Apr 04, 2025 pm 02:42 PM
What should I do if I encounter garbled code printing for front-end thermal paper receipts?
Apr 04, 2025 pm 02:42 PM
Frequently Asked Questions and Solutions for Front-end Thermal Paper Ticket Printing In Front-end Development, Ticket Printing is a common requirement. However, many developers are implementing...
 Who gets paid more Python or JavaScript?
Apr 04, 2025 am 12:09 AM
Who gets paid more Python or JavaScript?
Apr 04, 2025 am 12:09 AM
There is no absolute salary for Python and JavaScript developers, depending on skills and industry needs. 1. Python may be paid more in data science and machine learning. 2. JavaScript has great demand in front-end and full-stack development, and its salary is also considerable. 3. Influencing factors include experience, geographical location, company size and specific skills.
 Demystifying JavaScript: What It Does and Why It Matters
Apr 09, 2025 am 12:07 AM
Demystifying JavaScript: What It Does and Why It Matters
Apr 09, 2025 am 12:07 AM
JavaScript is the cornerstone of modern web development, and its main functions include event-driven programming, dynamic content generation and asynchronous programming. 1) Event-driven programming allows web pages to change dynamically according to user operations. 2) Dynamic content generation allows page content to be adjusted according to conditions. 3) Asynchronous programming ensures that the user interface is not blocked. JavaScript is widely used in web interaction, single-page application and server-side development, greatly improving the flexibility of user experience and cross-platform development.
 How to merge array elements with the same ID into one object using JavaScript?
Apr 04, 2025 pm 05:09 PM
How to merge array elements with the same ID into one object using JavaScript?
Apr 04, 2025 pm 05:09 PM
How to merge array elements with the same ID into one object in JavaScript? When processing data, we often encounter the need to have the same ID...
 How to achieve parallax scrolling and element animation effects, like Shiseido's official website?
or:
How can we achieve the animation effect accompanied by page scrolling like Shiseido's official website?
Apr 04, 2025 pm 05:36 PM
How to achieve parallax scrolling and element animation effects, like Shiseido's official website?
or:
How can we achieve the animation effect accompanied by page scrolling like Shiseido's official website?
Apr 04, 2025 pm 05:36 PM
Discussion on the realization of parallax scrolling and element animation effects in this article will explore how to achieve similar to Shiseido official website (https://www.shiseido.co.jp/sb/wonderland/)...
 The difference in console.log output result: Why are the two calls different?
Apr 04, 2025 pm 05:12 PM
The difference in console.log output result: Why are the two calls different?
Apr 04, 2025 pm 05:12 PM
In-depth discussion of the root causes of the difference in console.log output. This article will analyze the differences in the output results of console.log function in a piece of code and explain the reasons behind it. �...
 Is JavaScript hard to learn?
Apr 03, 2025 am 12:20 AM
Is JavaScript hard to learn?
Apr 03, 2025 am 12:20 AM
Learning JavaScript is not difficult, but it is challenging. 1) Understand basic concepts such as variables, data types, functions, etc. 2) Master asynchronous programming and implement it through event loops. 3) Use DOM operations and Promise to handle asynchronous requests. 4) Avoid common mistakes and use debugging techniques. 5) Optimize performance and follow best practices.
 How to implement panel drag and drop adjustment function similar to VSCode in front-end development?
Apr 04, 2025 pm 02:06 PM
How to implement panel drag and drop adjustment function similar to VSCode in front-end development?
Apr 04, 2025 pm 02:06 PM
Explore the implementation of panel drag and drop adjustment function similar to VSCode in the front-end. In front-end development, how to implement VSCode similar to VSCode...
