

How to draw a polygon based on random points in canvas

This article mainly introduces the relevant information on how to draw a polygon based on random points in canvas. The content is quite good. I will share it with you now and give it as a reference.
Cause
When I was studying the book "HTML5 Javascript Animation Basics" today, I talked about it in the third section of Chapter 8 How to use three springs to connect three points to perform a stretching exercise.
After finishing the example, I thought about what if it were four points or five points.
I rewrote the code and made the number of points variable. The final effect is to achieve the final stretching movement of each point to balance, but the connections between the points are not very good-looking, and some are crossed.
So I thought about whether I could optimize this area.
Rotating connection
The points in the previous example are all at random positions, so the connection is uncontrollable. So I want to start with this first.
First use a certain point as a reference point to obtain the angles of other points relative to this point.
Then connect these points according to the angle from small to large, so that you can draw a normal polygon.
The approximate implementation code is as follows:
let balls = [];
let ballNum = 6;
let firstBall = null;
while(ballNum--) {
let ball = new Ball(20, parseColor(Math.random() * 0xffffff))
ball.x = Math.random() * width;
ball.y = Math.random() * height;
balls.push(ball)
if (!firstBall) {
firstBall = ball
ball.angle = 0
} else {
const dx = ball.x - firstBall.x,
dy = ball.y - firstBall.y;
ball.angle = Math.atan2(dy, dx);
}
}
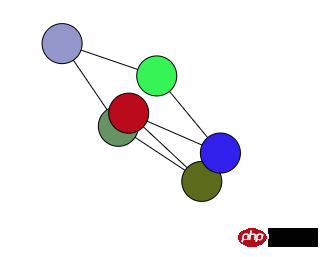
// 尝试让球连线是一个正多边形
balls = balls.sort((ballA, ballB) => {
return ballA.angle - ballB.angle
})In this way, when drawing the connection at the end, traversing the array can draw the angle from small to large. .
The effect is as follows:

This can greatly reduce the number of crossing lines, but it still cannot be completely avoided.
Next, I want to try to optimize this solution, such as using Math.abs to correct angle, or finding the point with the smallest angle to connect each point. But the result is no good, crossing lines cannot be avoided.
Rotation based on center point
Another idea came to mind later. If the center point of the polygon can be determined, then all points relative to the center are calculated separately. The angle between the points can be used to connect these points clockwise or counterclockwise.
But after searching for a long time on the Internet, all point algorithms require a series of points arranged in a certain clockwise order.
But if I have these points, I can already draw polygons. I had to give up
X-axis two-pole segmentation
In desperation, I had to search Google, and then I found an answer on Zhihu that was quite good. ’s: How to connect an unordered set of points on the plane into a simple polygon?
For the specific algorithm description, just look at the answer, I won’t go into details.
However, when connecting the upper chain and the lower chain, in fact, you only need to ensure that the upper chain is connected in descending order on the X axis, and the lower chain is connected in ascending order on the X axis (drawn in a counterclockwise direction). As for the points with the same X axis, it doesn't matter whether the Y axis is larger or smaller.
When implemented, it is implemented strictly according to the algorithm in the answer.
When judging whether a point belongs to the upper chain or the lower chain, the initial idea is to determine the function equation of the straight line based on two points, and then introduce the coordinates of the points for calculation. But later I thought that all points use the leftmost pole to calculate the oblique angle, and then divide it according to the angle size, which is easier to understand visually.
The approximate code is as follows:
let balls = [];
let tempBalls = [];
let ballNum = 6;
let isDragingBall = false;
while(ballNum--) {
let ball = new Ball(10, parseColor(Math.random() * 0xffffff))
ball.x = Math.random() * width;
ball.y = Math.random() * height;
tempBalls.push(ball)
}
// 让点按X轴升序排序
tempBalls = tempBalls.sort((ballA, ballB) => {
return ballA.x - ballB.x
})
// 找X轴左右极点
let firstBall = tempBalls[0],
lastBall = tempBalls[tempBalls.length -1];
let smallXBalls = tempBalls.filter(ball => ball.x === firstBall.x),
bigXBalls = tempBalls.filter(ball => ball.x === lastBall.x)
// 处理左右极点有多个的情况
if (smallXBalls.length > 1) {
smallXBalls.sort((ballA, ballB) => {
return ballB.y - ballA.y
})
}
if (bigXBalls.length > 1) {
bigXBalls.sort((ballA, ballB) => {
return ballB.y - ballA.y
})
}
firstBall = smallXBalls[0]
lastBall = bigXBalls[0]
// 获得极点连线的角度
let splitLineAngle = Math.atan2(lastBall.y - firstBall.y, lastBall.x - firstBall.x);
let upperBalls = [],
lowerBalls = [];
// 所有其他点跟firstBall计算角度
// 大于splitLineAngle的都是下链
// 其他是上链
tempBalls.forEach(ball => {
if (ball === firstBall || ball === lastBall) {
return false
}
let angle = Math.atan2(ball.y - firstBall.y, ball.x - firstBall.x);
if (angle > splitLineAngle) {
lowerBalls.push(ball)
} else {
upperBalls.push(ball)
}
})
// 处理X轴相同情况的排序
lowerBalls = lowerBalls.sort((ballA, ballB) => {
if (ballA.x !== ballB.x) {
return ballA.x - ballB.x
}
return ballB.y - ballA.y
})
upperBalls = upperBalls.sort((ballA, ballB) => {
if (ballA.x !== ballB.x) {
return ballB.x - ballA.x
}
return ballB.y - ballB.x
})
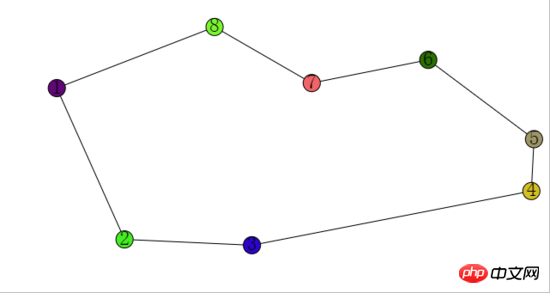
// 逆时针连接所有的点
balls = [firstBall].concat(lowerBalls, [lastBall], upperBalls)
balls = balls.map((ball, i) => {
ball.text = i + 1;
return ball
})The balls finally returned are the points of the polygon sorted counterclockwise.
The effect is as follows:
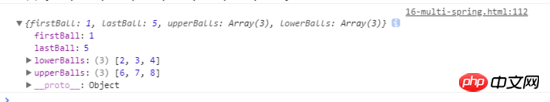
The internal state of each ball is as follows:
The above is the content of this article All content, I hope it will be helpful to everyone's learning. For more related content, please pay attention to the PHP Chinese website!
Related recommendations:
Use html5
Canvas encapsulates a pie chart that echarts cannot implement
HTML5 Canvas implements the method of drawing curves
The above is the detailed content of How to draw a polygon based on random points in canvas. For more information, please follow other related articles on the PHP Chinese website!

Hot AI Tools

Undresser.AI Undress
AI-powered app for creating realistic nude photos

AI Clothes Remover
Online AI tool for removing clothes from photos.

Undress AI Tool
Undress images for free

Clothoff.io
AI clothes remover

Video Face Swap
Swap faces in any video effortlessly with our completely free AI face swap tool!

Hot Article
Hot Tools

Notepad++7.3.1
Easy-to-use and free code editor

SublimeText3 Chinese version
Chinese version, very easy to use

Zend Studio 13.0.1
Powerful PHP integrated development environment

Dreamweaver CS6
Visual web development tools

SublimeText3 Mac version
God-level code editing software (SublimeText3)
Hot Topics
 1386
1386
 52
52

 Can the floor plan be drawn directly in architectural ppt?
Mar 20, 2024 am 08:43 AM
Can the floor plan be drawn directly in architectural ppt?
Mar 20, 2024 am 08:43 AM
ppt is widely used in many fields and work, especially in education, architecture, etc. When it comes to architectural ppt, we must first think of the presentation of some architectural drawings. If we do not use professional drawing software, can we directly draw a simple architectural plan? In fact, we can complete the operation here. Below, we will draw a relatively simple floor plan to give you an idea. I hope you can complete better floor plan drawings based on this idea. 1. First, we double-click to open the ppt software on the desktop and click to create a new presentation blank document. 2. We find Insert→Shape→Rectangle in the menu bar. 3. After drawing the rectangle, double-click the graphic and modify the fill color type. Here we can modify
 heptagon number
Sep 24, 2023 am 10:33 AM
heptagon number
Sep 24, 2023 am 10:33 AM
Aheptagonalnumberisanumberwhichcanberepresentedasaheptagon.Aheptagonisapolygonwith7sides.Aheptagonalnumbercanberepresentedasacombinationofsuccessivelayersofheptagon(7-sidedpolygon).Heptagonalnumbercanbebetterexplainedwiththebelowfigures. therefore,
 What versions of html2canvas are there?
Aug 22, 2023 pm 05:58 PM
What versions of html2canvas are there?
Aug 22, 2023 pm 05:58 PM
The versions of html2canvas include html2canvas v0.x, html2canvas v1.x, etc. Detailed introduction: 1. html2canvas v0.x, which is an early version of html2canvas. The latest stable version is v0.5.0-alpha1. It is a mature version that has been widely used and verified in many projects; 2. html2canvas v1.x, this is a new version of html2canvas.
 How to draw a 3D geographic chart with Python
Sep 28, 2023 am 10:19 AM
How to draw a 3D geographic chart with Python
Sep 28, 2023 am 10:19 AM
Overview of how to draw 3D geographic charts with Python: Drawing 3D geographic charts can help us understand geographic data and spatial distribution more intuitively. Python, as a powerful and easy-to-use programming language, provides many libraries and tools for drawing various types of geographical charts. In this article, we will learn how to draw 3D geographic charts using the Python programming language and some popular libraries such as Matplotlib and Basemap. Environment preparation: Before starting, we need to make sure
 Learn to draw dendrograms and radar charts in Python in five minutes
Sep 27, 2023 pm 12:48 PM
Learn to draw dendrograms and radar charts in Python in five minutes
Sep 27, 2023 pm 12:48 PM
Learn to draw dendrograms and radar charts with Python in five minutes. In data visualization, dendrograms and radar charts are two commonly used chart forms. Treemaps are used to show hierarchical structures, while radar charts are used to compare data across multiple dimensions. This article will introduce how to draw these two charts using Python and provide specific code examples. 1. Drawing dendrograms There are multiple libraries in Python that can be used to draw dendrograms, such as matplotlib and graphviz. The following uses the matplotlib library as an example to demonstrate
 Learn the canvas framework and explain the commonly used canvas framework in detail
Jan 17, 2024 am 11:03 AM
Learn the canvas framework and explain the commonly used canvas framework in detail
Jan 17, 2024 am 11:03 AM
Explore the Canvas framework: To understand what are the commonly used Canvas frameworks, specific code examples are required. Introduction: Canvas is a drawing API provided in HTML5, through which we can achieve rich graphics and animation effects. In order to improve the efficiency and convenience of drawing, many developers have developed different Canvas frameworks. This article will introduce some commonly used Canvas frameworks and provide specific code examples to help readers gain a deeper understanding of how to use these frameworks. 1. EaselJS framework Ea
 uniapp implements how to use canvas to draw charts and animation effects
Oct 18, 2023 am 10:42 AM
uniapp implements how to use canvas to draw charts and animation effects
Oct 18, 2023 am 10:42 AM
How to use canvas to draw charts and animation effects in uniapp requires specific code examples 1. Introduction With the popularity of mobile devices, more and more applications need to display various charts and animation effects on the mobile terminal. As a cross-platform development framework based on Vue.js, uniapp provides the ability to use canvas to draw charts and animation effects. This article will introduce how uniapp uses canvas to achieve chart and animation effects, and give specific code examples. 2. canvas
 Learn to draw line charts, bar charts and pie charts with Python in three minutes
Sep 27, 2023 am 09:29 AM
Learn to draw line charts, bar charts and pie charts with Python in three minutes
Sep 27, 2023 am 09:29 AM
Learn to draw line charts, bar charts, and pie charts with Python in three minutes. Python is a very popular programming language that is widely used in data analysis and visualization. In this article, we will learn how to draw three common types of charts using Python: line charts, bar charts, and pie charts. I'll provide you with specific code examples to help you get started quickly. Line Chart A line chart is a type of chart that shows trend changes by connecting data points. In Python, we can use the matplotlib library to plot
