

How to implement China map in vue+vuex+axios+echarts
This article mainly introduces the method of using vue vuex axios echarts to draw a dynamically updated map of China. It has certain reference value. Interested friends can refer to it.
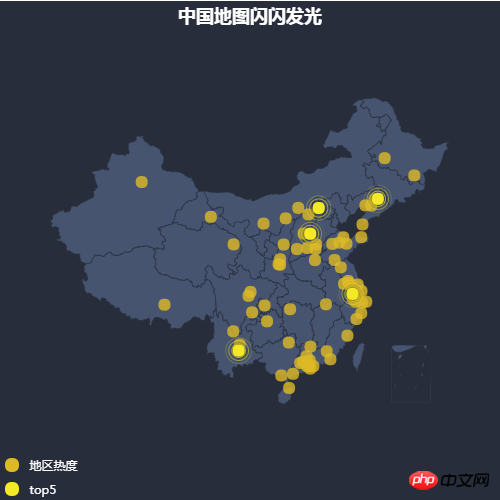
This article introduces vue vuex axios I would like to share with you how echarts draws a dynamically updated map of China. The details are as follows:
1. Generate the project and install the plug-in
# 安装vue-cli
npm install vue-cli -g
# 初始化项目
vue init webpack china-map
# 切到目录下
cd china-map
# 安装项目依赖
npm install
# 安装 vuex
npm install vuex --save
# 安装 axios
npm install axios --save
# 安装 ECharts
npm install echarts --save
2. Project Structure
├── index.html
├── main.js
├── components
│  └── index.vue
└── store
  ├── index.js     # 组装模块及导出store的文件
  └── modules
└── ChinaMap.js # 中国地图Vuex模块3. Introduce China map and draw basic charts
1.Introduce Echarts charts and components related to China map as required.
// 主模块
let echarts = require('echarts/lib/echarts')
// 散点图
require('echarts/lib/chart/scatter')
// 散点图放大
require('echarts/lib/chart/effectScatter')
// 地图
require('echarts/lib/chart/map')
// 图例
require('echarts/lib/component/legend')
// 提示框
require('echarts/lib/component/tooltip')
// 地图geo
require('echarts/lib/component/geo')
2. Introducing the China map JS file will automatically register the map; you can also introduce the json file through axios, and you need to manually register echarts.registerMap('china', chinaJson.data).
// 中国地图JS文件
require('echarts/map/js/china')
3. Prepare a DOM container with fixed width and height and initialize an echarts instance in mounted.
DOM container
<template>
 <p id="china-map"></p>
</template>
Initialize echarts instance
let chinaMap = echarts.init(document.getElementById('china-map'))
4. Set the initialized blank map. You need to set many echarts parameters here. Please refer to the ECharts configuration item manual.
chinaMap.setOption({
  backgroundColor: '#272D3A',
  // 标题
  title: {
   text: '中国地图闪闪发光',
   left: 'center',
   textStyle: {
    color: '#fff'
   }
  },
  // 地图上圆点的提示
  tooltip: {
   trigger: 'item',
   formatter: function (params) {
    return params.name + ' : ' + params.value[2]
   }
  },
  // 图例按钮 点击可选择哪些不显示
  legend: {
   orient: 'vertical',
   left: 'left',
   top: 'bottom',
   data: ['地区热度', 'top5'],
   textStyle: {
    color: '#fff'
   }
  },
  // 地理坐标系组件
  geo: {
   map: 'china',
   label: {
    // true会显示城市名
    emphasis: {
     show: false
    }
   },
   itemStyle: {
    // 地图背景色
    normal: {
     areaColor: '#465471',
     borderColor: '#282F3C'
    },
    // 悬浮时
    emphasis: {
     areaColor: '#8796B4'
    }
   }
  },
  // 系列列表
  series: [
   {
    name: '地区热度',
    // 表的类型 这里是散点
    type: 'scatter',
    // 使用地理坐标系,通过 geoIndex 指定相应的地理坐标系组件
    coordinateSystem: 'geo',
    data: [],
    // 标记的大小
    symbolSize: 12,
    // 鼠标悬浮的时候在圆点上显示数值
    label: {
     normal: {
      show: false
     },
     emphasis: {
      show: false
     }
    },
    itemStyle: {
     normal: {
      color: '#ddb926'
     },
     // 鼠标悬浮的时候圆点样式变化
     emphasis: {
      borderColor: '#fff',
      borderWidth: 1
     }
    }
   },
   {
    name: 'top5',
    // 表的类型 这里是散点
    type: 'effectScatter',
    // 使用地理坐标系,通过 geoIndex 指定相应的地理坐标系组件
    coordinateSystem: 'geo',
    data: [],
    // 标记的大小
    symbolSize: 12,
    showEffectOn: 'render',
    rippleEffect: {
     brushType: 'stroke'
    },
    hoverAnimation: true,
    label: {
     normal: {
      show: false
     }
    },
    itemStyle: {
     normal: {
      color: '#f4e925',
      shadowBlur: 10,
      shadowColor: '#333'
     }
    },
    zlevel: 1
   }
  ]
})4. Configure Vuex management and distribution data
1. Introduce vuex and axios into ChinaMap.js.
import axios from 'axios'
2. Set the necessary variables.
const state = {
 geoCoordMap: {'香港特别行政区': [114.08, 22.2], '澳门特别行政区': [113.33, 22.13], '台北': [121.5, 25.03]/*等等*/},
 // 发光的城市
 showCityNumber: 5,
 showCount: 0,
 // 是否需要loading
 isLoading: true
}3. Capture background data in actions and update the map.
const actions = {
 fetchHeatChinaRealData ({state, commit}, chartsObj) {
  axios.get('static/data/heatChinaRealData.json')
   .then(
    (res) => {
     let data = res.data
     let paleData = ((state, data) => {
      let arr = []
      let len = data.length
      while (len--) {
       let geoCoord = state.geoCoordMap[data[len].name]
       if (geoCoord) {
        arr.push({
         name: data[len].name,
         value: geoCoord.concat(data[len].value)
        })
       }
      }
      return arr
     })(state, data)
     let lightData = paleData.sort((a, b) => {
      return b.value - a.value
     }).slice(0, state.showCityNumber)
     chartsObj.setOption({
      series: [
       {
        name: '地区热度',
        data: paleData
       },
       {
        name: 'top5',
        data: lightData
       }
      ]
     })
    }
   )
 }
}At this time npm run dev can already see the flashing yellow dots on the map of China.
If you want to change it to display dynamically, you can add under mounted in index.vue:
chinaMap.showLoading(showLoadingDefault)
this.$store.commit('openLoading')
this.$store.dispatch('fetchHeatChinaRealData', chinaMap)
setInterval(() => {
  this.$store.dispatch('fetchHeatChinaRealData', chinaMap)
}, 1000)Modify fetchHeatChinaRealData in the mutations of actions in ChinaMap.js:
let lightData = paleData.sort((a, b) => {
  return b.value - a.value
}).slice(0 + state.showCount, state.showCityNumber + state.showCount)
if (state.isLoading) {
  chartsObj.hideLoading()
  commit('closeLoading')
}5. Others
1. Don’t forget to introduce Vuex into main.js.
import Vue from 'vue'
import Index from './components/index.vue'
import store from './store/index'
let ChinaMap = new Vue({
el: '#app',
store,
template: '<Index/>',
components: {Index}
})
Vue.use(ChinaMap)2. Case code
GitHub
3. Effect picture
The above is what I compiled for everyone , I hope it will be helpful to everyone in the future.
Related articles:
How to control the mouse to refuse to click the button in JS
How to implement floating collision in JS
About using bootstrap-table.js to implement extended paging toolbar function
About the difference between substring() and substr() (detailed tutorial)
How to determine whether a variable name exists in an array in JavaScript
The above is the detailed content of How to implement China map in vue+vuex+axios+echarts. For more information, please follow other related articles on the PHP Chinese website!

Hot AI Tools

Undresser.AI Undress
AI-powered app for creating realistic nude photos

AI Clothes Remover
Online AI tool for removing clothes from photos.

Undress AI Tool
Undress images for free

Clothoff.io
AI clothes remover

Video Face Swap
Swap faces in any video effortlessly with our completely free AI face swap tool!

Hot Article
Hot Tools

Notepad++7.3.1
Easy-to-use and free code editor

SublimeText3 Chinese version
Chinese version, very easy to use

Zend Studio 13.0.1
Powerful PHP integrated development environment

Dreamweaver CS6
Visual web development tools

SublimeText3 Mac version
God-level code editing software (SublimeText3)
Hot Topics
 1386
1386
 52
52

 How to use bootstrap in vue
Apr 07, 2025 pm 11:33 PM
How to use bootstrap in vue
Apr 07, 2025 pm 11:33 PM
Using Bootstrap in Vue.js is divided into five steps: Install Bootstrap. Import Bootstrap in main.js. Use the Bootstrap component directly in the template. Optional: Custom style. Optional: Use plug-ins.
 How to add functions to buttons for vue
Apr 08, 2025 am 08:51 AM
How to add functions to buttons for vue
Apr 08, 2025 am 08:51 AM
You can add a function to the Vue button by binding the button in the HTML template to a method. Define the method and write function logic in the Vue instance.
 How to reference js file with vue.js
Apr 07, 2025 pm 11:27 PM
How to reference js file with vue.js
Apr 07, 2025 pm 11:27 PM
There are three ways to refer to JS files in Vue.js: directly specify the path using the <script> tag;; dynamic import using the mounted() lifecycle hook; and importing through the Vuex state management library.
 How to use watch in vue
Apr 07, 2025 pm 11:36 PM
How to use watch in vue
Apr 07, 2025 pm 11:36 PM
The watch option in Vue.js allows developers to listen for changes in specific data. When the data changes, watch triggers a callback function to perform update views or other tasks. Its configuration options include immediate, which specifies whether to execute a callback immediately, and deep, which specifies whether to recursively listen to changes to objects or arrays.
 What does vue multi-page development mean?
Apr 07, 2025 pm 11:57 PM
What does vue multi-page development mean?
Apr 07, 2025 pm 11:57 PM
Vue multi-page development is a way to build applications using the Vue.js framework, where the application is divided into separate pages: Code Maintenance: Splitting the application into multiple pages can make the code easier to manage and maintain. Modularity: Each page can be used as a separate module for easy reuse and replacement. Simple routing: Navigation between pages can be managed through simple routing configuration. SEO Optimization: Each page has its own URL, which helps SEO.
 How to return to previous page by vue
Apr 07, 2025 pm 11:30 PM
How to return to previous page by vue
Apr 07, 2025 pm 11:30 PM
Vue.js has four methods to return to the previous page: $router.go(-1)$router.back() uses <router-link to="/" component window.history.back(), and the method selection depends on the scene.
 How to query the version of vue
Apr 07, 2025 pm 11:24 PM
How to query the version of vue
Apr 07, 2025 pm 11:24 PM
You can query the Vue version by using Vue Devtools to view the Vue tab in the browser's console. Use npm to run the "npm list -g vue" command. Find the Vue item in the "dependencies" object of the package.json file. For Vue CLI projects, run the "vue --version" command. Check the version information in the <script> tag in the HTML file that refers to the Vue file.
 How to use vue traversal
Apr 07, 2025 pm 11:48 PM
How to use vue traversal
Apr 07, 2025 pm 11:48 PM
There are three common methods for Vue.js to traverse arrays and objects: the v-for directive is used to traverse each element and render templates; the v-bind directive can be used with v-for to dynamically set attribute values for each element; and the .map method can convert array elements into new arrays.
