
 Backend Development
PHP Tutorial
Implementation of PHP using Echarts to generate statistical reports
Backend Development
PHP Tutorial
Implementation of PHP using Echarts to generate statistical reports
Implementation of PHP using Echarts to generate statistical reports
This article mainly introduces the implementation code of PHP using Echarts to generate data statistical reports. Friends who need it can refer to
echarts statistics, a simple example
First look at the renderings
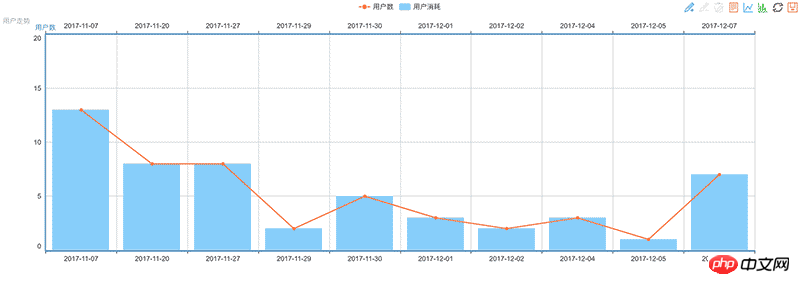
Look at the code
HTML page prepares a Dom for ECharts, with customized width and height
<p class="panel panel-info">
  <p class="panel-body">
    <p id="echart_show" style="height:500px"></p>
  </p>
</p>
js file can refer to the official website, or download it here, introduce
The following is the specific method
<script type="text/javascript">
var date = [],num = [];
$(document).ready(function () {
// 绘制反馈量图形
var init_echarts = function () {
var refreshChart = function (show_data) {
my_demo_chart = echarts.init(document.getElementById('echart_show'));
my_demo_chart.showLoading({
text: '加载中...',
effect: 'whirling'
});
var echarts_all_option = {
title: {
text: '',
subtext: '用户走势'
},
tooltip: {
trigger: 'axis'
},
legend: {
data: ['用户数', '用户消耗']
},
toolbox: {
show: true,
feature: {
mark: {show: true},
dataView: {show: true, readOnly: false},
magicType: {show: true, type: ['line', 'bar']},
restore: {show: true},
saveAsImage: {show: true}
// myTool2: {
// show: true,
// title: '自定义扩展方法',
// icon: 'image://http://echarts.baidu.com/images/favicon.png',
// onclick: function (){
// alert('自定义')
// }
// }
}
},
dataZoom: {
show: false,
start: 0,
end: 100
},
xAxis: [
{
type: 'category',
boundaryGap: true,
data: show_data[1]
},
{
type: 'category',
boundaryGap: true,
data: show_data[1]
}
],
yAxis: [
{
type: 'value',
scale: true,
name: '用户数',
boundaryGap: [0, 0.5]
// boundaryGap: [0.2, 0.2]
},
{
type: 'value',
scale: true,
name: '用户数',
boundaryGap: [0, 0.5]
}
],
series: [
{
name: '用户消耗',
type: 'bar',
xAxisIndex: 1,
data: show_data[0]
},
{
name: '用户数',
type: 'line',
xAxisIndex: 1,
data:show_data[0]
}
]
};
my_demo_chart.hideLoading();
my_demo_chart.setOption(echarts_all_option);
};
// 获取原始数据
$.ajax({
url:"__CONTROLLER__/getRes",
async:false,
dataType:'json',
type:'post',
success:function(msg){
var result = msg.result;
if(msg.code == 200){
for(var i = 0 ; i < result.length; i++){
date.push(result[i].date);
num.push(result[i].count);
msg[0] = num;
msg[1] = date;
refreshChart(msg);
}
}
}
});
};
// 默认加载
var default_load = (function () {
init_echarts();
})();
});
</script>Query the data you need in the controller (queried here Date and corresponding quantity)
//折线统计
  public function getRes(){
    $user = M('account');
    $sql = "SELECT date(createTime) AS date,count(*) as count FROM t_account GROUP BY date ";
    $result = $user->query($sql);
    $this->ajaxReturn(array('code'=>200,'result'=>$result));
}At this point, a simple echarts statistical chart comes out
I am not sure about some parameters in echarts If you understand, you can refer to the official website Echarts Documentation
Related recommendations:
PHP determines the operator based on the mobile phone number
Laravel5 .2 Use Captcha to generate verification codes to achieve login
Detailed explanation of bucket sorting of PHP sorting algorithm series
The above is the detailed content of Implementation of PHP using Echarts to generate statistical reports. For more information, please follow other related articles on the PHP Chinese website!

Hot AI Tools

Undresser.AI Undress
AI-powered app for creating realistic nude photos

AI Clothes Remover
Online AI tool for removing clothes from photos.

Undress AI Tool
Undress images for free

Clothoff.io
AI clothes remover

Video Face Swap
Swap faces in any video effortlessly with our completely free AI face swap tool!

Hot Article
Hot Tools

Notepad++7.3.1
Easy-to-use and free code editor

SublimeText3 Chinese version
Chinese version, very easy to use

Zend Studio 13.0.1
Powerful PHP integrated development environment

Dreamweaver CS6
Visual web development tools

SublimeText3 Mac version
God-level code editing software (SublimeText3)
Hot Topics
 1387
1387
 52
52

 PHP 8.4 Installation and Upgrade guide for Ubuntu and Debian
Dec 24, 2024 pm 04:42 PM
PHP 8.4 Installation and Upgrade guide for Ubuntu and Debian
Dec 24, 2024 pm 04:42 PM
PHP 8.4 brings several new features, security improvements, and performance improvements with healthy amounts of feature deprecations and removals. This guide explains how to install PHP 8.4 or upgrade to PHP 8.4 on Ubuntu, Debian, or their derivati
 7 PHP Functions I Regret I Didn't Know Before
Nov 13, 2024 am 09:42 AM
7 PHP Functions I Regret I Didn't Know Before
Nov 13, 2024 am 09:42 AM
If you are an experienced PHP developer, you might have the feeling that you’ve been there and done that already.You have developed a significant number of applications, debugged millions of lines of code, and tweaked a bunch of scripts to achieve op
 How To Set Up Visual Studio Code (VS Code) for PHP Development
Dec 20, 2024 am 11:31 AM
How To Set Up Visual Studio Code (VS Code) for PHP Development
Dec 20, 2024 am 11:31 AM
Visual Studio Code, also known as VS Code, is a free source code editor — or integrated development environment (IDE) — available for all major operating systems. With a large collection of extensions for many programming languages, VS Code can be c
 Explain JSON Web Tokens (JWT) and their use case in PHP APIs.
Apr 05, 2025 am 12:04 AM
Explain JSON Web Tokens (JWT) and their use case in PHP APIs.
Apr 05, 2025 am 12:04 AM
JWT is an open standard based on JSON, used to securely transmit information between parties, mainly for identity authentication and information exchange. 1. JWT consists of three parts: Header, Payload and Signature. 2. The working principle of JWT includes three steps: generating JWT, verifying JWT and parsing Payload. 3. When using JWT for authentication in PHP, JWT can be generated and verified, and user role and permission information can be included in advanced usage. 4. Common errors include signature verification failure, token expiration, and payload oversized. Debugging skills include using debugging tools and logging. 5. Performance optimization and best practices include using appropriate signature algorithms, setting validity periods reasonably,
 How do you parse and process HTML/XML in PHP?
Feb 07, 2025 am 11:57 AM
How do you parse and process HTML/XML in PHP?
Feb 07, 2025 am 11:57 AM
This tutorial demonstrates how to efficiently process XML documents using PHP. XML (eXtensible Markup Language) is a versatile text-based markup language designed for both human readability and machine parsing. It's commonly used for data storage an
 PHP Program to Count Vowels in a String
Feb 07, 2025 pm 12:12 PM
PHP Program to Count Vowels in a String
Feb 07, 2025 pm 12:12 PM
A string is a sequence of characters, including letters, numbers, and symbols. This tutorial will learn how to calculate the number of vowels in a given string in PHP using different methods. The vowels in English are a, e, i, o, u, and they can be uppercase or lowercase. What is a vowel? Vowels are alphabetic characters that represent a specific pronunciation. There are five vowels in English, including uppercase and lowercase: a, e, i, o, u Example 1 Input: String = "Tutorialspoint" Output: 6 explain The vowels in the string "Tutorialspoint" are u, o, i, a, o, i. There are 6 yuan in total
 Explain late static binding in PHP (static::).
Apr 03, 2025 am 12:04 AM
Explain late static binding in PHP (static::).
Apr 03, 2025 am 12:04 AM
Static binding (static::) implements late static binding (LSB) in PHP, allowing calling classes to be referenced in static contexts rather than defining classes. 1) The parsing process is performed at runtime, 2) Look up the call class in the inheritance relationship, 3) It may bring performance overhead.
 What are PHP magic methods (__construct, __destruct, __call, __get, __set, etc.) and provide use cases?
Apr 03, 2025 am 12:03 AM
What are PHP magic methods (__construct, __destruct, __call, __get, __set, etc.) and provide use cases?
Apr 03, 2025 am 12:03 AM
What are the magic methods of PHP? PHP's magic methods include: 1.\_\_construct, used to initialize objects; 2.\_\_destruct, used to clean up resources; 3.\_\_call, handle non-existent method calls; 4.\_\_get, implement dynamic attribute access; 5.\_\_set, implement dynamic attribute settings. These methods are automatically called in certain situations, improving code flexibility and efficiency.
