 Backend Development
 PHP Tutorial
 Method 1 of using XHProf to analyze PHP performance bottlenecks
Method 1 of using XHProf to analyze PHP performance bottlenecks
Jul 07, 2018 pm 03:34 PMInstall xhprof extension
wget http://pecl.php.net/get/xhprof-0.9.4.tgz
tar zxf xhprof-0.9.4.tgz
cd xhprof-0.9.4/extension/
sudo phpize
./configure
sudo make
sudo make install
cd ../
Configure php.ini
[xhprof]
extension=xhprof.so
xhprof.output_dir=/tmp
Note: xhprof has not been updated for a long time. As of now, it does not support php7. php7 can use https://github. com/phacility/….
Configure xhprof environment
You need to copy the two directories in the xhprof compressed package to the specified directory (assuming it is defined to /work/xhprof/):
mkdir /work/xhprof/
cp -a xhprof_html/ /work/xhprof/
cp -a xhprof_lib/ /work/xhprof/
Then add in the entry file of the project framework:
<div class="code" style="position:relative; padding:0px; margin:0px;"><div class="code" style="position:relative; padding:0px; margin:0px;"><pre class="brush:php;toolbar:false">xhprof_enable(XHPROF_FLAGS_MEMORY | XHPROF_FLAGS_CPU); register_shutdown_function(function() { $xhprof_data = xhprof_disable(); if (function_exists(&#39;fastcgi_finish_request&#39;)){ fastcgi_finish_request(); } include_once "/work/xhprof/xhprof_lib/utils/xhprof_lib.php"; include_once "/work/xhprof/xhprof_lib/utils/xhprof_runs.php"; $xhprof_runs = new XHProfRuns_Default(); $run_id = $xhprof_runs->save_run($xhprof_data, &#39;xhprof&#39;); });</pre><div class="contentsignin">Copy after login</div></div><div class="contentsignin">Copy after login</div></div>Code analysis: $xhprof_data records all function call times and CPU memory consumption during program running. The specific recorded indicators can be controlled through the parameters of xhprof_enable. The currently supported parameters are:
##HPROF_FLAGS_NO_BUILTINS
Skip all built-in (internal) functions.XHPROF_FLAGS_CPU
Adds CPU data to the output performance data.XHPROF_FLAGS_MEMORY
Add memory data to the output performance data.
XHProfRuns_Default, serialize $xhprof_data and save it to a certain directory, you can output the results to the current directory through XHProfRuns_Default(__DIR__). If not specified, xhprof.output_dir## in the php.ini configuration file will be read. #, if still not specified, it will be output to /tmp.
and xhprof_disable appear in pairs, one is at the front of the code running, and the other is at the end. In the middle is the code to be analyzed. After the above configuration, if we subsequently request the project interface, xhprof will analyze the CPU, memory, time consumption, etc. during the request process. The log is saved in the
directory. Configuring web
After configuration, how to check the log? We can build a simple web server:
xhprof.test.com.conf
server {
    listen       80;
    server_name  xhprof.test.com;

    root /work/xhprof/xhprof_html;
    index  index.html index.php;


    location ~ \.php$ {
        fastcgi_pass   127.0.0.1:9000;
        fastcgi_index  index.php;
        fastcgi_param  SCRIPT_FILENAME  $document_root$fastcgi_script_name;
        include        fastcgi_params;
    }
}and then configure the virtual host xhprof.test.com. Restart nginx and open xhprof.test.com to see the effect:

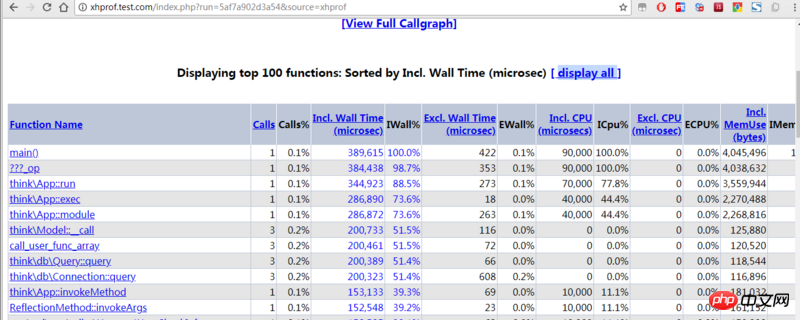 is listed in the default UI :
- funciton name : Function name
- calls: Number of calls
- Incl. Wall Time (microsec): Function running time (including sub-functions)
- IWall%: Function running time (including sub-functions) proportion
- Excl . Wall Time (microsec): Function running time (excluding sub-functions)
- EWall%: Function running time (excluding sub-functions)
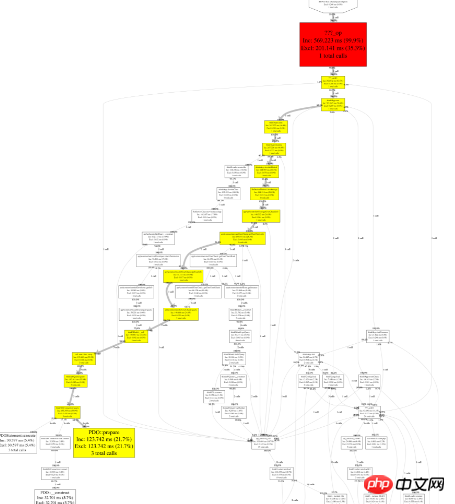
- You can also see the [View Full Callgraph] link on the web. After clicking it, a visual performance analysis graph can be drawn. If an error is reported after clicking, it may be due to a lack of dependency on graphviz. Graphviz is a graph drawing tool that allows you to view performance bottlenecks more intuitively. You can install it if necessary:
yum install -y libpng
yum install -y graphviz
Effect:
 Non-intrusive introduction of xhprof
Previously we implemented the analysis by adding code to the project entry file function. A more elegant way is to create an additional file xhprof.inc.php and save it in the
/work/xhprof/ directory: <div class="code" style="position:relative; padding:0px; margin:0px;"><div class="code" style="position:relative; padding:0px; margin:0px;"><pre class="brush:php;toolbar:false">xhprof_enable(XHPROF_FLAGS_MEMORY | XHPROF_FLAGS_CPU);
register_shutdown_function(function() {
$xhprof_data = xhprof_disable();
if (function_exists(&#39;fastcgi_finish_request&#39;)){
fastcgi_finish_request();
}
include_once "/work/xhprof/xhprof_lib/utils/xhprof_lib.php";
include_once "/work/xhprof/xhprof_lib/utils/xhprof_runs.php";
$xhprof_runs = new XHProfRuns_Default();
$run_id = $xhprof_runs->save_run($xhprof_data, &#39;xhprof&#39;);
});</pre><div class="contentsignin">Copy after login</div></div><div class="contentsignin">Copy after login</div></div>Use the automatic loading function of PHP before executing the code Inject this file, edit php.ini:
auto_prepend_file = /work/xhprof/xhprof.inc.php
and then restart the PHP service. This will take effect for everyone using this php environment.
Or you can also write it into the nginx configuration of the specified project:
jifen.cc.conflocation ~ \.php$ {
fastcgi_pass 127.0.0.1:9000;
fastcgi_index index.php;
fastcgi_param SCRIPT_FILENAME $document_root$fastcgi_script_name;
fastcgi_param PHP_VALUE "auto_prepend_file=/work/xhprof/xhprof.inc.php";
include fastcgi_params;
}Then restart the nginx service. This only takes effect for this project.
Files included via auto_prepend_file and auto_append_file will be parsed in this mode, but there are some restrictions, such as functions must be defined before being called.
Modify the sampling frequency
By default, xhprof will run every time. If the online environment is set like this, it will have an impact on performance.
xhprof.inc.php
<?php
$profiling = !(mt_rand()%9);
if($profiling) xhprof_enable(XHPROF_FLAGS_MEMORY | XHPROF_FLAGS_CPU);
register_shutdown_function(function() use($profiling) {
if($profiling){
$xhprof_data = xhprof_disable();
if (function_exists('fastcgi_finish_request')){
fastcgi_finish_request();
}
include_once "/work/xhprof/xhprof_lib/utils/xhprof_lib.php";
include_once "/work/xhprof/xhprof_lib/utils/xhprof_runs.php";
$xhprof_runs = new XHProfRuns_Default();
$xhprof_runs->save_run($xhprof_data, 'xhprof');
}
});Summary
In this article, we introduced how to analyze PHP performance based on xhprof extension, record it in the log, and finally use The UI that comes with the xhprof extension is displayed on the web. Main knowledge points:
- Install xhprof extension
- Inject xhprof into the application
- Based on nginx Display analysis results
- The above is the entire content of this article. I hope it will be helpful to everyone’s study. For more related content, please pay attention to the PHP Chinese website!
Related recommendations:
Notes on php-fpm parameter configuration of php7The above is the detailed content of Method 1 of using XHProf to analyze PHP performance bottlenecks. For more information, please follow other related articles on the PHP Chinese website!

Hot Article

Hot tools Tags

Hot Article

Hot Article Tags

Notepad++7.3.1
Easy-to-use and free code editor

SublimeText3 Chinese version
Chinese version, very easy to use

Zend Studio 13.0.1
Powerful PHP integrated development environment

Dreamweaver CS6
Visual web development tools

SublimeText3 Mac version
God-level code editing software (SublimeText3)

Hot Topics
 PHP 8.4 Installation and Upgrade guide for Ubuntu and Debian
Dec 24, 2024 pm 04:42 PM
PHP 8.4 Installation and Upgrade guide for Ubuntu and Debian
 How To Set Up Visual Studio Code (VS Code) for PHP Development
Dec 20, 2024 am 11:31 AM
How To Set Up Visual Studio Code (VS Code) for PHP Development


