It is very common to report errors in our PHP development, and the most commonly used troubleshooting method is probably var_dump or print_r. In this way, we have to go to var_dump and print_r everywhere during development, which is obviously very slow, and phpstorm This editor is still used by a lot of people in the current market. Many people may not have discovered that there is an xdebug function in phpstorm. So what is xdebug? What is this function used for? Php Chinese website today will talk about what xdebug is and how to use xdebug.
1. What is xdebug?
I have already talked about xdebug in phpstorm above. In development, we basically use var_dump or print_r for troubleshooting. This method is very low and inconvenient. Then this xdebug completely replaces the var_dump or print_r we type step by step in the code, making our development faster!
2. How to use xdebug?
I said such nonsense just to bring out our xdebug! With comparison, you can see how convenient xdebug is! Next we will configure xdebug in phpstorm.
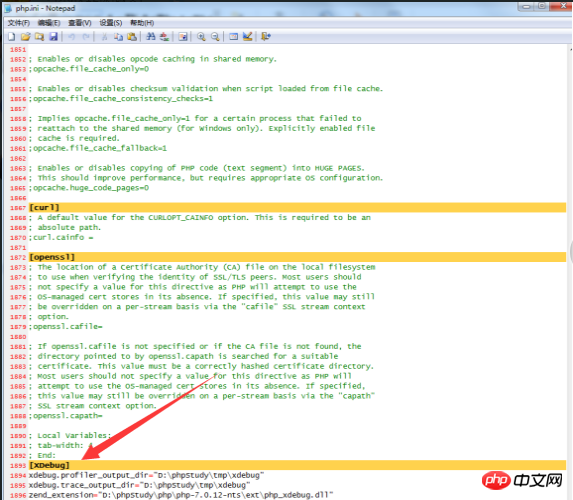
3. (is phpstudy) Go to the other options menu to open the configuration file php.ini. We drag it directly to the end and you will find the code starting with The xdebug configuration here is incomplete. We have to add remote port, automatic tracking and other information configuration here. The code is as follows:
// 这里是远程端口,远程端口是可以根据自己设置的。
xdebug.remote_port=9018
// 远程自动启动,我们设置的是1,也就是启动
xdebug.remote_autostart=1
// 自动跟踪,我们设置的也是1,也就是自动跟踪
xdebug.auto_trace=1
// 远程主机ip
xdebug.remote_host = "127.0.0.1"
// 远程开启,1为开启
xdebug.remote_enable=1
Step 2
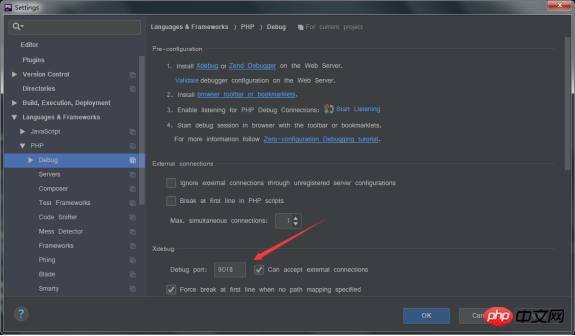
: Open phpstorm, go to Languages & Frameworks in the settings, find debug under PHP and click to open itFor example, the picture below
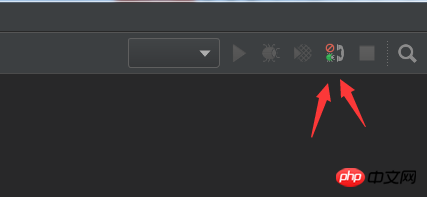
Step 3: To use xdebug, we are in phpstorm There is a button similar to a small phone in the upper right corner.
For example, in the picture below
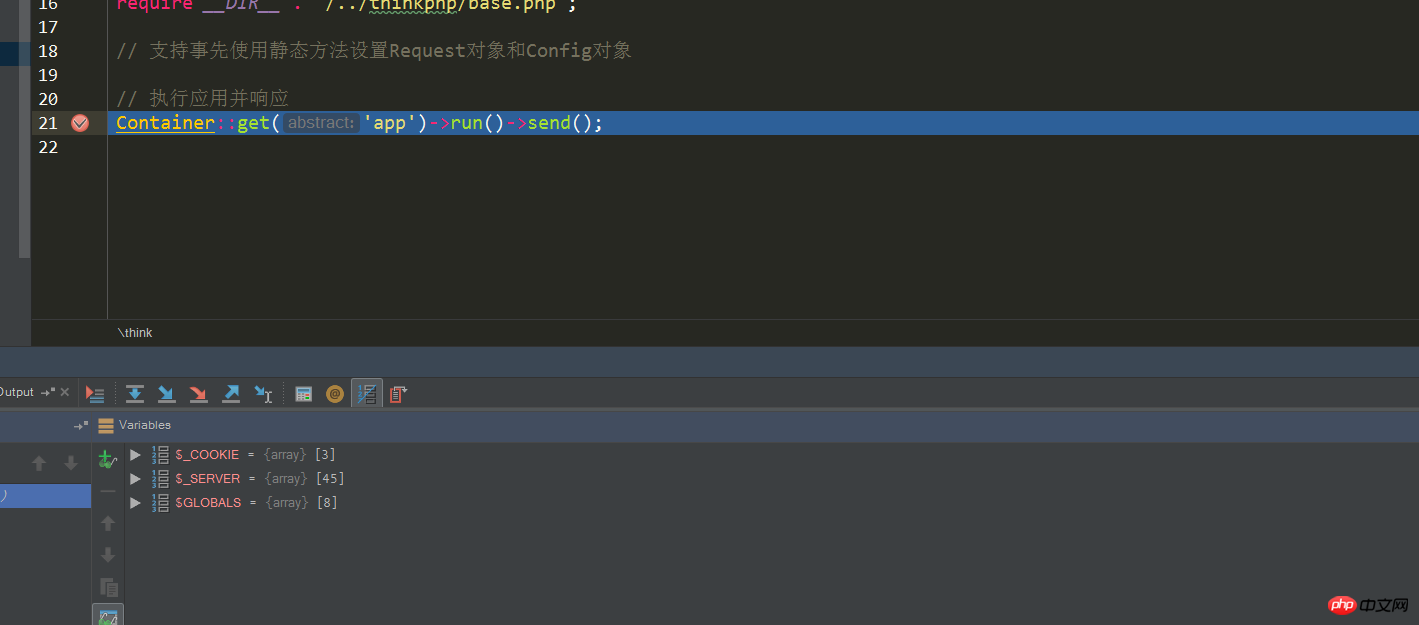
means it is enabled. When we need to use it for troubleshooting in the code, we only need to click after the line number of the code. If the following picture appears, it means that we have successfully locked it
In this way, we can directly open our project in the browser and run it, and it will jump directly to our phpstorm. For example, as shown below

 If we want to close this troubleshooting result, click the square in the upper right corner to close it.

 How about the xdebug error debugging tool in the latest version of PHPstorm? Isn’t it very convenient! Okay, that’s it for the tutorial. I hope you can support the original articles on the php Chinese website!
The above is the detailed content of High-efficiency PHP debugging error prompt tool: Detailed explanation of xdebug configuration and usage in the latest version of PHPstorm (picture). For more information, please follow other related articles on the PHP Chinese website!


