An article to help you learn spring boot breakpoint debugging
I recently imported a Spring Boot project. I don’t understand a lot of the business logic and can’t understand it. I can only debug it to see where to start.
Since it runs directly under the spring boot application, the direct Debug operation cannot enter the breakpoint. It can be seen that there is a problem with my debugging method. After various inquiries, I got the solution. The process is as follows:
1. Configure pom.xml
	<build>
		<plugins>
			<plugin>
				<groupId>org.springframework.boot</groupId>
				<artifactId>spring-boot-maven-plugin</artifactId>
				<configuration>
	                <jvmArguments>
	                	-Xdebug -Xrunjdwp:transport=dt_socket,server=y,suspend=y,address=5005
	                </jvmArguments>
            	</configuration>
			</plugin>
		</plugins>
</build>-Xdebug is to notify the JVM to work in DEBUG mode
-Xrunjdwp is to notify the JVM to use (java debug wire protocol) to run debugging environment. This parameter combines a series of debugging options.
transport specifies the transmission method of debugging data. dt_socket refers to the SOCKET mode.
The server parameter refers to whether it is supported in the VM in server mode.
suspend indicates whether it is in the server mode. After the debug client is established, then execute the VM. If it is y, then the current VM is suspended until a debug client connects and the program execution is not started. If your program is not in server listening mode and is executed quickly, you can choose to block its startup at y.
address=5005 The port number of the debugging server, the port number used by the client to connect to the server.
2. Use maven to build:
Maven startup command: clean install -Ptest -X spring-boot:run (-Ptest means startup in the test environment, remove it during actual application. Otherwise, an error of missing test project will be reported; -X means forced execution). The spring boot project that does not depend on any public configuration can be executed independently (i.e. start button).
build successful!
3. Configure eclipse’s debug tool for debugging
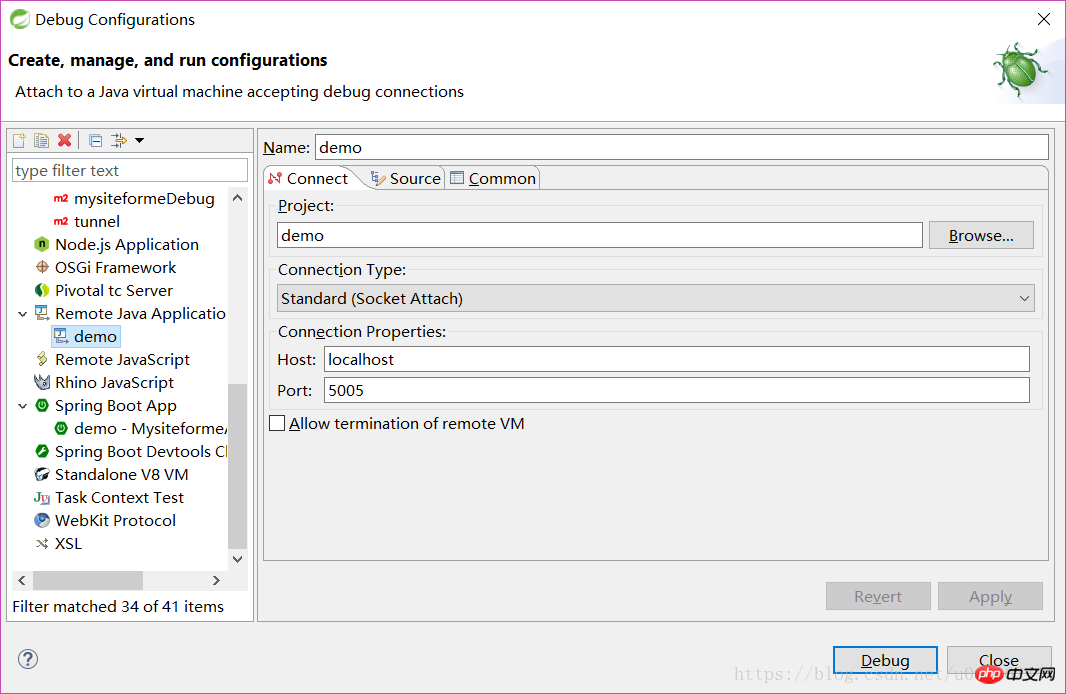
Right-click the project–>select debug as–>Debug Configuration–>Remote Java Application
As shown in the figure below, configure host and port. Since the project is started locally, localhost is used, and port uses the value of the address configured previously, which is port 5005. Then click debug to connect to debug


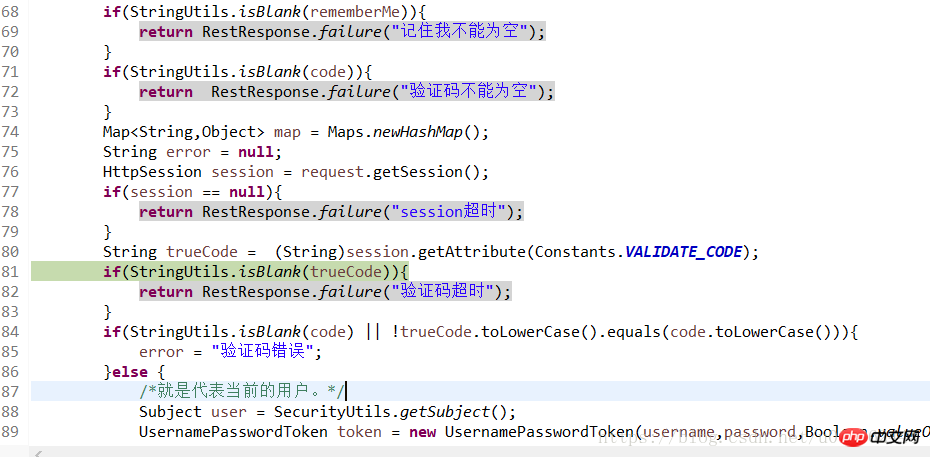
4. Break point, debug

The above is the detailed content of An article to help you learn spring boot breakpoint debugging. For more information, please follow other related articles on the PHP Chinese website!

Hot AI Tools

Undresser.AI Undress
AI-powered app for creating realistic nude photos

AI Clothes Remover
Online AI tool for removing clothes from photos.

Undress AI Tool
Undress images for free

Clothoff.io
AI clothes remover

Video Face Swap
Swap faces in any video effortlessly with our completely free AI face swap tool!

Hot Article

Hot Tools

Notepad++7.3.1
Easy-to-use and free code editor

SublimeText3 Chinese version
Chinese version, very easy to use

Zend Studio 13.0.1
Powerful PHP integrated development environment

Dreamweaver CS6
Visual web development tools

SublimeText3 Mac version
God-level code editing software (SublimeText3)

Hot Topics
 1392
1392
 52
52
 Spring Boot+MyBatis+Atomikos+MySQL (with source code)
Aug 15, 2023 pm 04:12 PM
In actual projects, we try to avoid distributed transactions. However, sometimes it is really necessary to do some service splitting, which will lead to distributed transaction problems. At the same time, distributed transactions are also asked in the market during interviews. You can practice with this case, and you can talk about 123 in the interview.
 Achieve multi-language support and international applications through Spring Boot
Jun 23, 2023 am 09:09 AM
With the development of globalization, more and more websites and applications need to provide multi-language support and internationalization functions. For developers, implementing these functions is not an easy task because it requires consideration of many aspects, such as language translation, date, time and currency formats, etc. However, using the SpringBoot framework, we can easily implement multi-language support and international applications. First, let us understand the LocaleResolver interface provided by SpringBoot. Loc
 How to use Spring Boot to build big data processing applications
Jun 23, 2023 am 09:07 AM
With the advent of the big data era, more and more companies are beginning to understand and recognize the value of big data and apply it to business. The problem that comes with it is how to handle this large flow of data. In this case, big data processing applications have become something that every enterprise must consider. For developers, how to use SpringBoot to build an efficient big data processing application is also a very important issue. SpringBoot is a very popular Java framework that allows
 Implement ORM mapping based on Spring Boot and MyBatis Plus
Jun 22, 2023 pm 09:27 PM
In the development process of Java web applications, ORM (Object-RelationalMapping) mapping technology is used to map relational data in the database to Java objects, making it convenient for developers to access and operate data. SpringBoot, as one of the most popular Java web development frameworks, has provided a way to integrate MyBatis, and MyBatisPlus is an ORM framework extended on the basis of MyBatis.
 How to use Spring Boot to build blockchain applications and smart contracts
Jun 22, 2023 am 09:33 AM
With the rise of digital currencies such as Bitcoin, blockchain technology has gradually become a hot topic. Smart contracts can be regarded as an important part of blockchain technology. SpringBoot, as a popular Java back-end development framework, can also be used to build blockchain applications and smart contracts. This article will introduce how to use SpringBoot to build applications and smart contracts based on blockchain technology. 1. SpringBoot and blockchain First, we need to understand some basic concepts related to blockchain. Blockchain
 Integration and use of Spring Boot and NoSQL database
Jun 22, 2023 pm 10:34 PM
With the development of the Internet, big data analysis and real-time information processing have become an important need for enterprises. In order to meet such needs, traditional relational databases no longer meet the needs of business and technology development. Instead, using NoSQL databases has become an important option. In this article, we will discuss the use of SpringBoot integrated with NoSQL databases to enable the development and deployment of modern applications. What is a NoSQL database? NoSQL is notonlySQL
 Building an ESB system using Spring Boot and Apache ServiceMix
Jun 22, 2023 pm 12:30 PM
As modern businesses rely more and more on a variety of disparate applications and systems, enterprise integration becomes even more important. Enterprise Service Bus (ESB) is an integration architecture model that connects different systems and applications together to provide common data exchange and message routing services to achieve enterprise-level application integration. Using SpringBoot and ApacheServiceMix, we can easily build an ESB system. This article will introduce how to implement it. SpringBoot and A
 Distributed data caching and storage system based on Spring Boot
Jun 22, 2023 am 09:48 AM
With the continuous development and popularization of the Internet, the demand for data processing and storage is also increasing. How to process and store data efficiently and reliably has become a hot topic among industry and researchers. The distributed data caching and storage system based on SpringBoot is a solution that has attracted much attention in recent years. What is a distributed data caching and storage system? Distributed data caching and storage system refers to the distributed storage of data through multiple nodes (servers), which improves the security and reliability of data, and can also improve data processing.


