
The content shared with you in this article is about how to draw line segments using canvas. The content is very detailed. Next, let’s take a look at the specific content. I hope it can help everyone.
To learn canvas, you must first know how to draw line segments, and then you can use many simple line segments to realize more complex graphics, such as common charts, bar charts, line charts, etc., all through segment by segment. realized by line segments.
The basic knowledge of canvas is not much, mainly mastering how to draw line segments, graphics, pictures, text, etc. Canvas can be drawn in the browser, or simple pictures can be drawn on the node server with the help of node-canvas. This article only records drawing in the browser. As for how to draw on the node side, you can check the relevant information yourself.
To draw in the browser, first define the canvas element in HTML. The default width and height are 300 * 150, which can be set by width and height. Note that the width and height of the canvas element style and the width and height of the canvas drawing canvas are not the same thing. This will be discussed later.
<canvas>
  <p>当前浏览器不支持canvas,请升级浏览器</p>
</canvas>
Before drawing, we must first obtain the 2d drawing context context of the current canvas, and subsequently draw by operating the context.
let canvas = document.querySelector('#canvas');
if (!canvas) {
  throw new Error('can not find canvas element');
}
// 注意2d.参数必须是小写的;
// 通过设置参数为webgl,可以获取3d绘制上下文
let ctx = canvas.getContext('2d');Note: The above code snippet will be ignored in subsequent examples, and the ctx variable will be used directly to represent the 2D drawing context of the canvas.
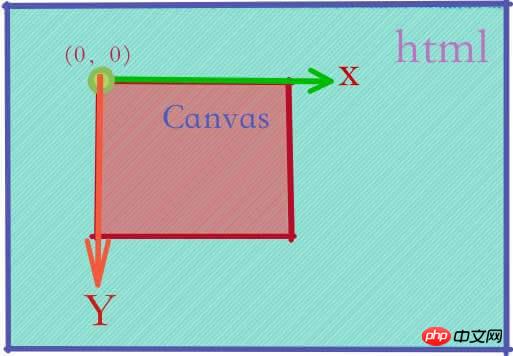
Let’s take a look at the coordinate system in canvas 2d drawing. The upper left corner of the current canvas element is the coordinate origin (0,0), the horizontal direction to the right is the positive direction of the X axis, and the vertical downward direction is the positive Y axis. direction, as shown below. You can operate the coordinate system through translation, rotation, and scale to achieve some animations. This part will be explained in detail in the animation knowledge section.
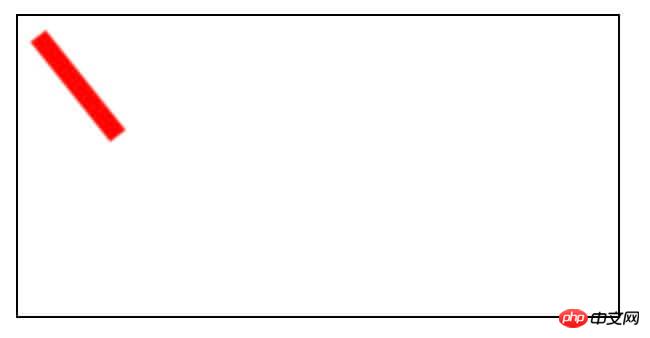
When drawing a simple line segment, you usually set the style of the line segment first, such as color, line width , line endpoint style, etc., we set the global drawing style of ctx by setting strokeStyle, which can be rgba or a legal hexadecimal color value, or gradient Objects etc. The following code simply draws a red line segment with a width of 10 from (10,10) to (50,60).
ctx.strokeStyle = 'red';
ctx.lineWidth = 10;
ctx.moveTo(10, 10);
ctx.lineTo(50, 60);
ctx.stroke();
Let’s first look at the methods and properties related to drawing line segments,
Related properties:
lineCap, this value tells the browser how to draw the endpoint of the line segment. The optional value is one of the following three: butt, round, square. The default is butt.
lineWidth, this value determines the pixel width of the line segment. Must be non-negative, non-infinite, defaults to 1.0.
lineJoin determines how to draw the focus when two line segments intersect. It will only take effect when the two line segments have different directions. Possible values: bevel, round, miter. The default value is miter.
miterLimit, tells the browser how to draw the line segment focus in the form of miter. It is only valid when lineJoin='miter', and the default is 10.0.
lineDashOffset, set the dash offset, the default is 0.0.
Related methods:
beginPath, clear all sub-paths in the current path to reset the current path . Generally, it must be called first when drawing a closed shape.
closePath, displays a closed path. This method is used for closed arc paths and open paths created from curves or line segments.
moveTo, move the current drawing point to the specified coordinates.
lineTo, draw a line segment from the previous point to the specified coordinate point.
setLineDash is a method used to set a dashed line. The parameter is an array indicating the length of the solid line drawn and the length of the gap between the solid lines.
Try to draw the same line segment by setting different lineCap values
ctx.lineWidth = 10;
ctx.textAlign = 'center';
let colors = ['red', 'green', 'blue'];
let lineCaps = ['butt', 'round', 'square'];
for (let [index, lc] of lineCaps.entries()) {
  ctx.strokeStyle = colors[index]; //设置线段的颜色
  ctx.lineCap = lc; // 设置lineCap
  ctx.beginPath(); // 清空当前路径
  ctx.moveTo(10, 20 + 20 * index);
  ctx.lineTo(50, 20 + 20 * index);
  ctx.stroke();
  ctx.fillText(lc, 80, 25 + 20 * index);
}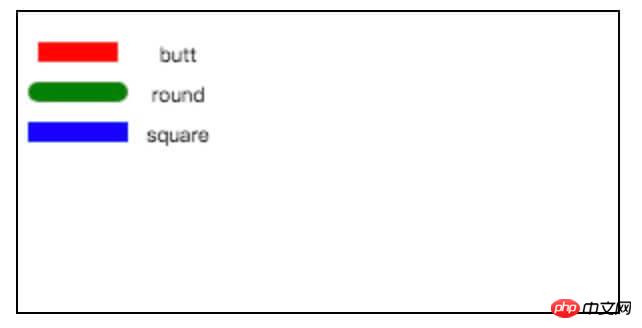
As can be seen from the results above, when lineCap is set to round and square, endpoints of a certain length will be added to both ends of the original line segment. It’s just that round is an arc style, and square is a rectangular style. One thing to note is that there can only be one current path in the canvas drawing context at the same time. In order to draw different line segments, beginPath() must be called before each drawing to clear the current route and start a new one. path.
Let’s try using different lineJoin values to draw the style of the focus of the two line segments
ctx.lineWidth = 20;
ctx.textAlign = 'center';
ctx.lineCap = 'butt';
let colors = ['red', 'green', 'blue'];
let lineJoins = ['bevel', 'round', 'miter'];
for (let [index, lj] of lineJoins.entries()) {
  ctx.strokeStyle = colors[index]; //设置线段的颜色
  ctx.lineJoin = lj; //设置lineJoin
  ctx.beginPath(); //清空当前路径
  ctx.moveTo(10 + 80 * index, 20);
  ctx.lineTo(50 + 80 * index, 20);
  ctx.lineTo(50 + 80 * index, 60);
  ctx.stroke();
  ctx.fillText(lj, 40 + 80 * index, 80);
}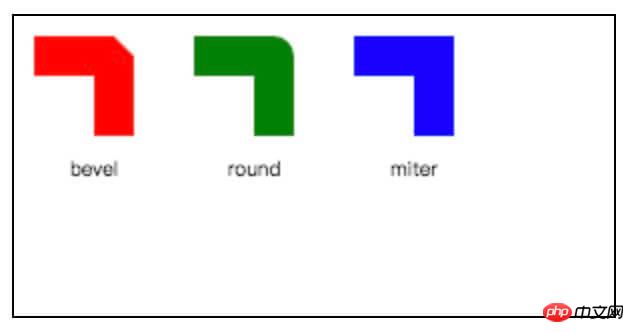
可以看到,三种lineJoin在处理两条线段的焦点处的不同。其中,在设置lineJoin="miter"时,通过设置miterLimit属性可以设置斜接线的长度与二分之一线宽的最大比值,当超过这个比值时,则lineJoin会采用bevel方式。
canvas不仅可以绘制实线,还可以绘制虚线。绘制虚线,通过设置lineDashOffset属性和调用setLineDash()方式。
ctx.lineWidth = 10;
ctx.textAlign = 'center';
ctx.setLineDash([8, 8]); //表示实线部分8个像素,间隙部分8个像素
let colors = ['red', 'green', 'blue'];
let lineDashOffsets = [1, 2, 4];
for (let [index, ldOffset] of lineDashOffsets.entries()) {
  ctx.strokeStyle = colors[index]; //线段颜色
  ctx.lineDashOffset = ldOffset; //设置了偏移量
  ctx.beginPath();
  ctx.moveTo(10, 20 + 20 * index);
  ctx.lineTo(100, 20 + 20 * index);
  ctx.stroke();
  ctx.fillText(`lineDashOffset:${ldOffset}`, 160, 25 + 20 * index);
}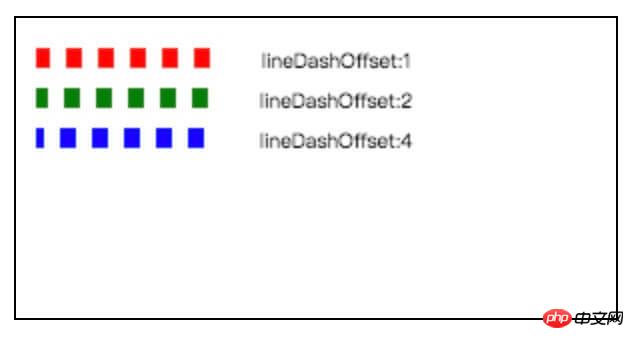
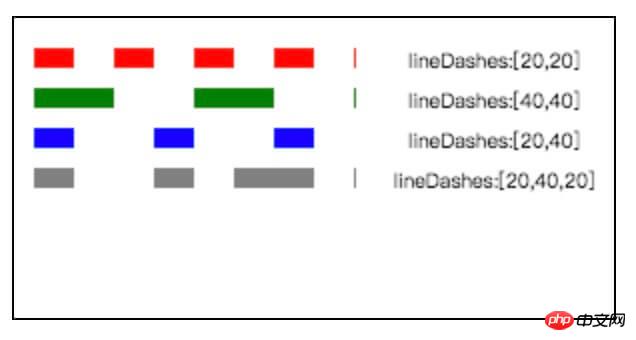
从图可以看到lineDashOffset就是设置的开始绘制虚线的偏移量。setLineDash()方法,接受一个数组参数,如果数组个数是奇数,则会默认把当前数组元素复制一份,使之变成偶数。从第0个元素,表示实线部分长度,第1个元素,表示间隙部分长度,第2个元素,表示实线部分长度,第3个元素,表示间隙部分长度,如果到数组最后一个元素了,又会从头开始,以此类推。
ctx.lineWidth = 10;
ctx.textAlign = 'center';
let colors = ['red', 'green', 'blue', 'gray'];
let lineDashes = [[20, 20], [40, 40], [20, 40], [20, 40, 20]];
for (let [index, ld] of lineDashes.entries()) {
  ctx.strokeStyle = colors[index]; //设置颜色
  ctx.setLineDash(ld); //设置lineDash
  ctx.beginPath();
  ctx.moveTo(10, 20 + 20 * index);
  ctx.lineTo(171, 20 + 20 * index);
  ctx.stroke();
  ctx.fillText(`lineDashes:[${ld}]`, 240, 25 + 20 * index);
}
可以通过动态设置lineDashOffset来实现蚁线,比如选择PS中选区边缘的蚁线。
let lineDashOffset = 0; //初始lineDashOffset
ctx.strokeStyle = 'green';
function animate() {
  if (lineDashOffset > 25) {
    lineDashOffset = 0;
  }
  ctx.clearRect(0, 0, width, height); //清空当前canvas
  ctx.lineDashOffset = -lineDashOffset; //设置lineDashOffset
  ctx.setLineDash([4, 4]); // 设置实线长度和间隙长度
  ctx.rect(20, 20, 100, 100); //绘制一个矩形
  ctx.stroke(); //对canvas当前路径描边
  lineDashOffset += 1; //lineDashOffset偏移加1
  window.requestAnimationFrame(animate); //用浏览器帧速率来反复执行animate函数
}
animate();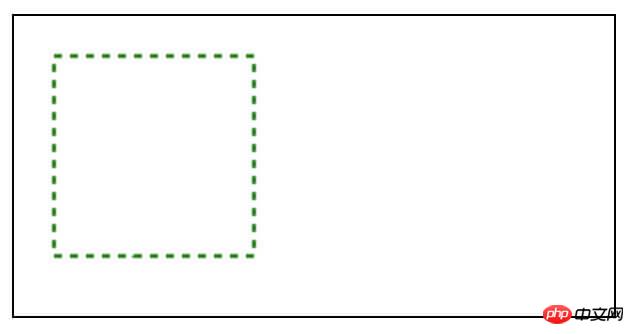
绘制线段时,要理解canvas当前路径概念,某一时刻,canvas中当前路径只有一条,在开始新的路径时,必须调用beginPath()。可以通过设置lineWidth,lineCap,lineJoin设置线段的绘制样式。在描边线段时,可以通过strokeStyle来设置线段的颜色。
canvas中不仅可以绘制实线,还可以通过lineDashOffset和setLineDash()来绘制虚线。
相关推荐:
The above is the detailed content of How to draw line segments using canvas. For more information, please follow other related articles on the PHP Chinese website!


