Recently I was reading a very classic Java book: "In-depth Understanding of Java Virtual Machines, Second Edition". I had read it a few years ago, but at that time, I was not interested in reading it, so I was confused and confused, so I stopped reading it. Looking back now, I find that it is indeed well written, and I can understand many knowledge points. It is also very in-depth and has gained a lot. Later, I plan to write a series of articles based on the content of this book to learn and review the knowledge related to Java virtual machine in depth.
After moving last weekend, the broadband at home has not been fixed. I reported this to the telecom customer service N times and finally made an appointment with a technician to migrate the broadband tomorrow morning. This can end the painful days of being without Internet for more than a week. I have been busy with various things during this period. I haven’t updated my blog for a week. The state and passion before I stop writing will slowly fade away. I always feel panicked. How can this be done? ! Take advantage of tomorrow's weekend to record some of this week's learning content on the company computer.
The JVM memory model is actually quite simple. Here are two knowledge points:
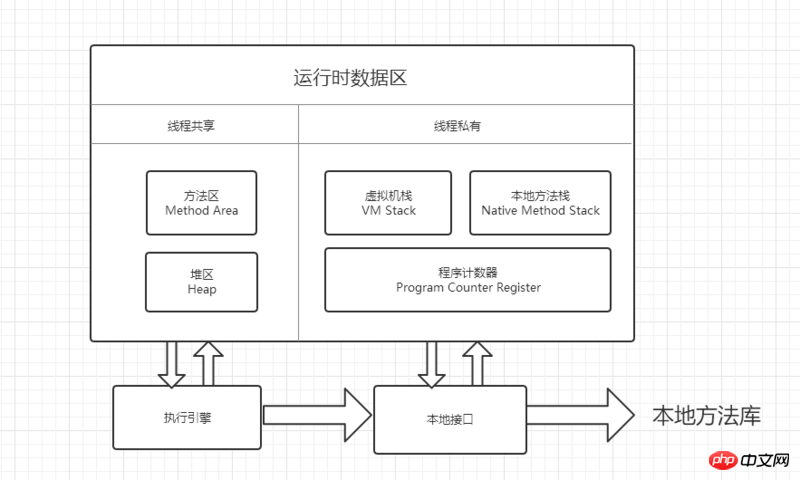
1. Composition: java heap, java stack (i.e. virtual machine stack), local method stack, method area and program counter.
2. Whether to share: The method area and heap area are shared by threads, and the virtual machine stack, local method stack and program counter are thread-private, also called thread-isolated. Each area stores different content. These two knowledge points must be kept in mind as they are the basis for mastering the JVM memory model.

The program counter in the JVM is a small memory area, but this memory area is quite interesting. There are 3 main features:
1. Storage content: For ordinary Java methods (that is, methods not modified with the native keyword), the address of the current instruction during execution is stored. For the native method, it is empty (undefined). Why? Because when calling the local method, the memory address of the JVM virtual machine may have been exceeded.
2. Thread private: Why is the program counter private to the thread? It is easy to understand based on the storage content. If it is shared by threads, when multiple threads are executing, they will not know which address the current thread is executing. Some threads are fast, and some are slow. The faster ones will enter after execution. Next, when the slow thread comes back from execution and finds that its address has changed, wouldn't it be messy?
3. It is the only area in the JVM that does not report a memory overflow (OutOfMemoryError).
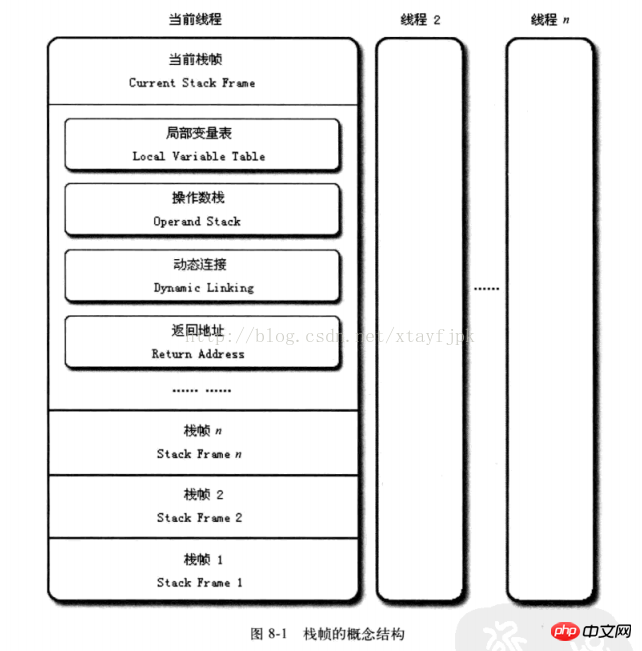
The virtual machine stack mainly stores stack frames. Each stack frame stores local variable tables, operand stacks, and dynamic links. and method export information, etc. The local variable table stores some local variables defined in the method, object references, parameters, and method return addresses, etc. The size of the space occupied by the local variable table can be determined at compile time. When the method is running, the space size of the local variable table will not change. This is easy to understand when combined with the content stored in the local variable table. The operand stack can be understood as loading and unloading the data of the current operation. For the 64-bit long and double types, each operand occupies 2 words wide (slot), and other types of operands occupy one word wide (slot). A stack frame is created when each method is called, and the execution process corresponds to the process of a stack frame being pushed into the virtual machine stack and popped out of the stack. Regarding the content of stack frames, you can refer to a blog written by a netizen: https://blog.csdn.net/xtayfjp..., which is very good and detailed. Here is a picture of the stack frame to make it clear at a glance.

There are two situations regarding virtual machine stack memory overflow:
1. The stack depth requested by the thread exceeds the depth allowed by the virtual machine, and an error message will be thrown. StackOverflowError, so when we see this exception in the code, we should think that there may be a problem with the virtual machine stack.
2. If the virtual machine stack can be dynamically expanded (most current JVMs can be dynamically expanded, but JVM also allows fixed-length virtual machine stacks), when sufficient memory cannot be applied for during expansion, an error message will be thrown. An OutOfMemoryError exception occurs.
This knowledge point is relatively simple. The functions of the local method stack and the virtual machine stack are similar, but they only serve when the JVM calls the native method, and the JVM The language used by native methods (for example, if Java calls functions implemented in C language, it needs to define native methods to implement them), usage methods, and data structures are not mandatory, so different virtual machines can implement them freely. Moreover, the HotSpot virtual machine directly combines the local method stack and the virtual machine stack into one. Similar to the virtual machine stack, the local method stack will also throw StackOverflowError and OutOfMemoryError.
The method area is a relatively important area. The Java virtual machine specification describes the method area as a logical part of the heap. However, in order to correspond to the Heap (heap area), it is also called Non-Heap (non-heap area). Mainly stored are static variables, constants (including runtime constants), class loading information and java compiled code. This part of the space does not need to be continuous. You can choose fixed size or expandable. Usually there is no GC in this part because the GC recycles static variables, constants and class loading information. The recycling effect of these objects is usually unsatisfactory. Therefore you can choose not to implement garbage collection. This area is also called the persistent generation. When this area of memory is insufficient, an OutOfMemoryError exception will also be reported.
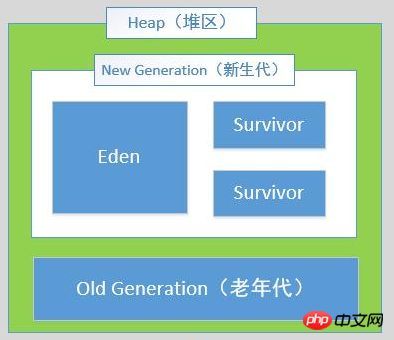
The Java heap area is the fattest area in the JVM memory, because all object instances and array objects are stored here. This area is shared by threads and will be created when the JVM starts. Think about it, if such a large space is private to threads, shouldn't the memory explode? According to the Java virtual machine specification, the contents of the heap area can be physically discontinuous, as long as they are logically continuous. When implemented, it can be fixed size or expandable, and it is usually expandable. We commonly use The memory parameters -Xms and -Xmx are used to adjust the heap size. The Java heap area is divided into the new generation and the old generation according to different life cycles. The new generation can be subdivided into Eden and Survivor areas, and Survivor can be subdivided into Survivor1 and Survivor2. These two usually only use one of them, and the other is used to retain surviving objects during GC. Most new objects are stored in the Eden area. If it is a large object, such as a large array or List object, you can use the JVM parameter -XX:PretenureSizeThreshold to directly store objects exceeding the specified size into the old generation. It should be noted that when writing a program, you should try to avoid large objects that live and die from entering the old generation, because the cost of GC in the old generation is greater than that of the young generation. The default size ratio of Eden and Survivor is 8:1:1, and the default GC algorithm for the new generation is the replication algorithm. The default GC algorithm for the old generation is mark-collation. These two GC algorithms will be explained in the next blog.
When there is not enough memory in the heap, an OutOfMemoryError exception will be thrown. Regarding the memory model of the heap area, you can refer to the following picture:

Related articles:
Detailed Overview of Java Virtual Machine
Detailed explanation of the working principle of Java virtual machine (pictures and texts)
Related videos:
Heima Cloud Classroom 8-day in-depth understanding of Python video tutorial
The above is the detailed content of Detailed graphic explanation of JAVA virtual machine related knowledge - JVM memory model. For more information, please follow other related articles on the PHP Chinese website!


