 Operation and Maintenance
 Linux Operation and Maintenance
 How to monitor instances through ECS's built-in monitoring service and cloud monitoring service
How to monitor instances through ECS's built-in monitoring service and cloud monitoring service
The content of this article is about how to monitor instances through the ECS built-in monitoring service and cloud monitoring service. It has certain reference value. Friends in need can refer to it. I hope it will be helpful to you.
Monitoring
It is very important to monitor the health of your ECS instances. You need to ensure that users can always quickly open your website and applications, or quickly complete tasks such as data processing and rendering. Alibaba Cloud provides services such as monitoring data collection, visualization, and real-time monitoring and alarming to ensure that your instances are always in normal running status.
Monitoring details
Currently, you can monitor instances through the ECS built-in monitoring service and cloud monitoring service. ECS's own monitoring service provides vCPU usage, network traffic, and disk I/O monitoring. Cloud monitoring provides more refined monitoring granularity. For more details, please refer to the monitoring item description. The following is an analysis of some monitoring information:
vCPU: Alibaba Cloud provides instance vCPU usage monitoring data, the unit is percentage. The higher the percentage value, the higher the instance vCPU load. You can query monitoring data through the ECS management console, cloud monitoring management console, calling the ECS API, or remotely connecting to the instance. The following is how to view vCPU usage after connecting to an instance remotely:
Windows instance: View vCPU usage in Task Manager. You can sort by vCPU usage to locate the processes occupying the instance vCPU resources.
Linux instance: Run the top command to view vCPU usage. Press Shift P on the keyboard to sort by vCPU usage and locate the processes occupying the instance vCPU resources.
Network traffic: Alibaba Cloud provides network traffic monitoring data in the outbound and inbound directions of the instance, in kbps. ECS's own monitoring service generally provides public network traffic monitoring, and cloud monitoring can obtain public network and intranet traffic monitoring. For example, your public network outbound bandwidth is 1 Mbps. When the outbound traffic reaches 1024 kbps, it means that your public network bandwidth is fully loaded.
ECS comes with monitoring service
The steps to view monitoring information on the ECS management console are as follows:
Log in to ECS Management console.
In the left navigation bar, click Instances.
Select a region.
Find the target instance and click the instance name.
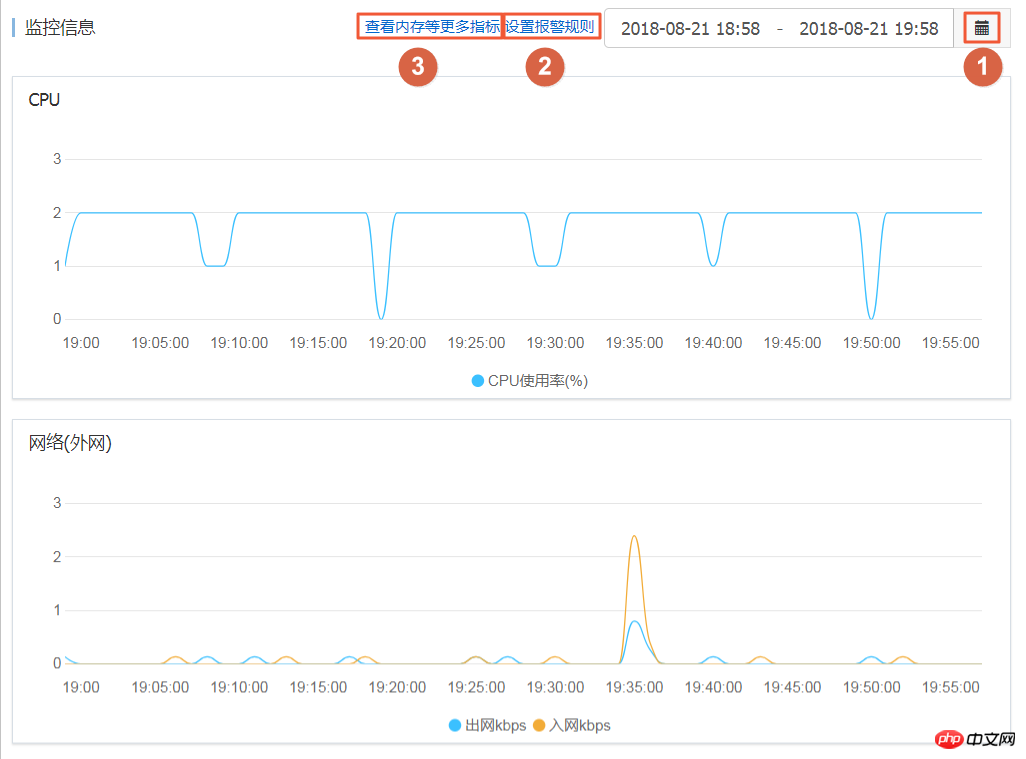
On the instance details page, you can see monitoring information, including vCPU usage and inbound and outbound network traffic.
Click the icon to set the monitoring time period.
Description
Due to the different display aggregation methods, the length of the selected time period will affect the accuracy of the display. The smaller the selected time range, the more detailed the display effect will be. For example, 5-minute and 15-minute averages will show different results.
(Optional) Click Set Alarm Rules to go to the cloud monitoring console to set vCPU usage and network traffic alarm rules. See the Alarm Services Overview for more details.
(Optional) Click to view more indicators such as memory to go to the cloud monitoring console to collect more data. After a moment, the monitoring data will be updated to the latest status.

You can also use the ECS API DescribeInstanceMonitorData, DescribeDiskMonitorData, and DescribeEniMonitorData to obtain monitoring data.
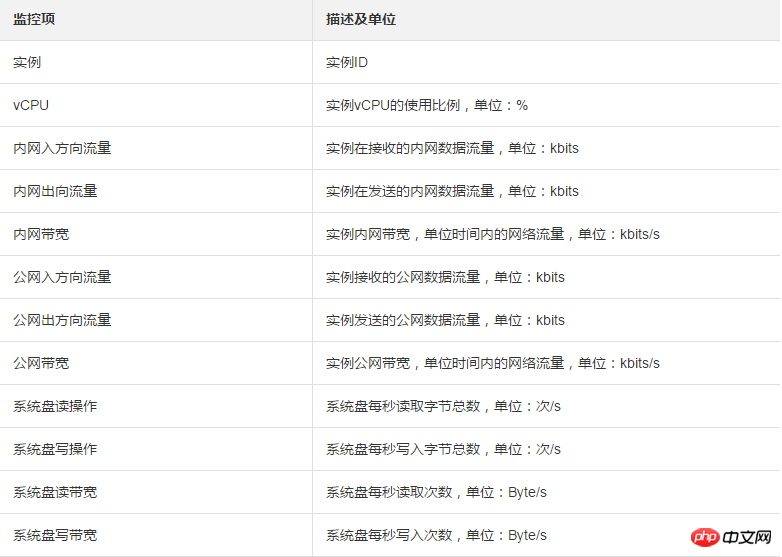
The following is a detailed list of monitoring items provided by ECS. The indicator collection granularity is 1 minute.

Cloud Monitoring
Cloud Monitoring provides you with an enterprise-level open one that can be used out of the box. Stationary monitoring solution. Cloud Monitor provides host monitoring services for your ECS. For more details, please see Host Monitoring Overview. The following steps demonstrate how to obtain ECS instance monitoring data from the Cloud Monitoring Management Console.
Log in to the cloud monitoring management console.
In the left navigation bar, click Host Monitoring.
Find the target instance.
(Optional) If the cloud monitoring plug-in is not installed on the instance, click Install to update the plug-in.
Click on the monitoring chart to obtain monitoring data.
Click Alarm Rules to set alarm rules.

Appendix: Knowledge related to bandwidth units
The difference between Kb and KB
Information in computers is represented by binary 0s and 1s. Each 0 or 1 is called a bit, represented by a lowercase b. 8 bits constitute 1 byte (Byte), similar to 0101 0010, represented by a capital B, 1 Byte=8 bits (1B=8b).
Use uppercase K or lowercase k to indicate thousands of hours, Kb is thousands of digits, and KB is kilobytes.
In the network traffic monitoring that comes with ECS, ps refers to /s, that is, per second. kbps refers to network speed, that is, how many kilobits of information are transmitted per second. Typically, bps is omitted when describing bandwidth. For example, the complete writing of 4M bandwidth should be 4 Mbps.
The relationship between bandwidth and download speed
Myth: The download speed is the same as the bandwidth.
Correct: Taking 1Mbps bandwidth as an example, 1KB=8Kb, 1Mbps=125KB/s, 1kbps=1000bps
The download rate of 1Mbps bandwidth is theoretically 125KB/s, but in some examples Applications will occupy a small amount of bandwidth, such as remote connections, so the actual download rate is often 100 KB/s~110KB/s.
The above is the detailed content of How to monitor instances through ECS's built-in monitoring service and cloud monitoring service. For more information, please follow other related articles on the PHP Chinese website!

Hot AI Tools

Undresser.AI Undress
AI-powered app for creating realistic nude photos

AI Clothes Remover
Online AI tool for removing clothes from photos.

Undress AI Tool
Undress images for free

Clothoff.io
AI clothes remover

AI Hentai Generator
Generate AI Hentai for free.

Hot Article

Hot Tools

Notepad++7.3.1
Easy-to-use and free code editor

SublimeText3 Chinese version
Chinese version, very easy to use

Zend Studio 13.0.1
Powerful PHP integrated development environment

Dreamweaver CS6
Visual web development tools

SublimeText3 Mac version
God-level code editing software (SublimeText3)

Hot Topics
 deepseek web version entrance deepseek official website entrance
Feb 19, 2025 pm 04:54 PM
DeepSeek is a powerful intelligent search and analysis tool that provides two access methods: web version and official website. The web version is convenient and efficient, and can be used without installation; the official website provides comprehensive product information, download resources and support services. Whether individuals or corporate users, they can easily obtain and analyze massive data through DeepSeek to improve work efficiency, assist decision-making and promote innovation.
 How to install deepseek
Feb 19, 2025 pm 05:48 PM
There are many ways to install DeepSeek, including: compile from source (for experienced developers) using precompiled packages (for Windows users) using Docker containers (for most convenient, no need to worry about compatibility) No matter which method you choose, Please read the official documents carefully and prepare them fully to avoid unnecessary trouble.
 BITGet official website installation (2025 beginner's guide)
Feb 21, 2025 pm 08:42 PM
BITGet is a cryptocurrency exchange that provides a variety of trading services including spot trading, contract trading and derivatives. Founded in 2018, the exchange is headquartered in Singapore and is committed to providing users with a safe and reliable trading platform. BITGet offers a variety of trading pairs, including BTC/USDT, ETH/USDT and XRP/USDT. Additionally, the exchange has a reputation for security and liquidity and offers a variety of features such as premium order types, leveraged trading and 24/7 customer support.
 Ouyi okx installation package is directly included
Feb 21, 2025 pm 08:00 PM
Ouyi OKX, the world's leading digital asset exchange, has now launched an official installation package to provide a safe and convenient trading experience. The OKX installation package of Ouyi does not need to be accessed through a browser. It can directly install independent applications on the device, creating a stable and efficient trading platform for users. The installation process is simple and easy to understand. Users only need to download the latest version of the installation package and follow the prompts to complete the installation step by step.
 Get the gate.io installation package for free
Feb 21, 2025 pm 08:21 PM
Gate.io is a popular cryptocurrency exchange that users can use by downloading its installation package and installing it on their devices. The steps to obtain the installation package are as follows: Visit the official website of Gate.io, click "Download", select the corresponding operating system (Windows, Mac or Linux), and download the installation package to your computer. It is recommended to temporarily disable antivirus software or firewall during installation to ensure smooth installation. After completion, the user needs to create a Gate.io account to start using it.
 Ouyi Exchange Download Official Portal
Feb 21, 2025 pm 07:51 PM
Ouyi, also known as OKX, is a world-leading cryptocurrency trading platform. The article provides a download portal for Ouyi's official installation package, which facilitates users to install Ouyi client on different devices. This installation package supports Windows, Mac, Android and iOS systems. Users can choose the corresponding version to download according to their device type. After the installation is completed, users can register or log in to the Ouyi account, start trading cryptocurrencies and enjoy other services provided by the platform.
 gate.io official website registration installation package link
Feb 21, 2025 pm 08:15 PM
Gate.io is a highly acclaimed cryptocurrency trading platform known for its extensive token selection, low transaction fees and a user-friendly interface. With its advanced security features and excellent customer service, Gate.io provides traders with a reliable and convenient cryptocurrency trading environment. If you want to join Gate.io, please click the link provided to download the official registration installation package to start your cryptocurrency trading journey.
 How to Install phpMyAdmin with Nginx on Ubuntu?
Feb 07, 2025 am 11:12 AM
This tutorial guides you through installing and configuring Nginx and phpMyAdmin on an Ubuntu system, potentially alongside an existing Apache server. We'll cover setting up Nginx, resolving potential port conflicts with Apache, installing MariaDB (


