
 Development Tools
webstorm
Introduction to the method of debugging node programs in webstorm (picture and text)
Development Tools
webstorm
Introduction to the method of debugging node programs in webstorm (picture and text)
Introduction to the method of debugging node programs in webstorm (picture and text)

This article brings you an introduction to the method of debugging node programs with webstorm (pictures and texts). It has certain reference value. Friends in need can refer to it. I hope it will be helpful to you.
Preface
I believe that everyone has come into contact with a lot of node code. If your application is relatively basic or it is specific to your project, you don’t need to come into contact with it. Deep node code, maybe you only need a simple console.log('your variable') to fully meet your needs. If you use node deeply and want to debug it, I think you should have come into contact with node-inspector. The general usage process is as follows -
1.安装:npm install -g node-inspector
2.启动debug模式(单独命令行):
    node-debug &(该命令默认8080端口)
    node-debug --web-port 1984 (定义任意端口)
3.访问chrome debug devTools
  路径如:http://127.0.0.1:1984/?ws=127.0.0.1:1984&port=5858
4.启动gulp或者grunt服务(具有gulp或者grunt任务时)
  node --debug-brk $(which grunt) server (这种模式使用在第一次初始化执行的代码)
node --debug $(which grunt) server(这种模式使用在初始化之后监听的node代码)The debugging panel is basically the same as the chrome developer tools, very If you are familiar with it and know how to use Chrome, you all know how to play it well, and there is no learning cost.
Here, I mainly introduce the use of webstorm to debug node code. I have searched on the Internet before, but it is not very reliable. Therefore, I have done more attempts and thinking, and I will summarize it here. I hope it can help students who use webstorm.
If you don’t know webstorm, well, take a look at the official introduction. Everyone has different opinions on the choice of editor, which will not be discussed here. I just personally used eclipse (aptana), sublime text, and webstorm. I advanced step by step and fell in love with webstorm. The functions are very powerful and the integration level is indeed relatively high. The basic usage will be discussed in detail when we have the opportunity. Here we only introduce how to debug the node program.
If you have played with Java, it is really convenient to use eclipse to debug. Or if you are playing with PHP, I believe phpstorm is also very good for debugging PHP code. It would be great if there was an IDE that could also debug Node. That's right, a webstorm can handle this.
Mainly follow the following directory introduction——
1.调试nodejs程序——常规用法(run/debug模式)、调试面板等介绍
2.调试gulp/grunt
3.调试web应用
1. Debugging nodejs program
As shown below——
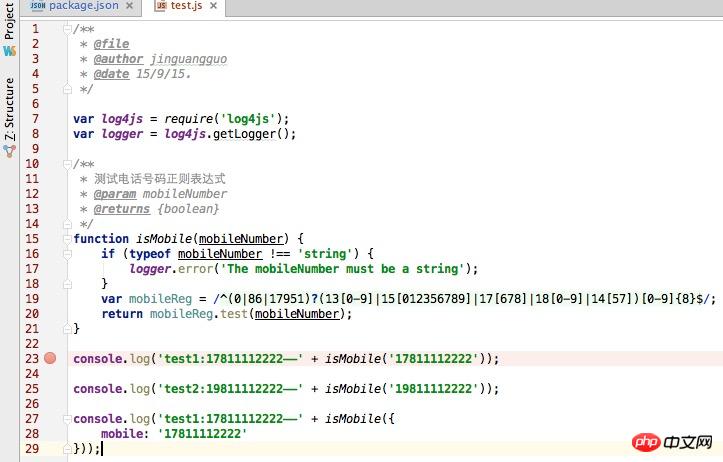
#You can see that a breakpoint is placed on line 23. If you want the breakpoint to take effect, you need to configure the debug configuration for the file -
Run mode. Running the file directly will not take effect on the breakpoint. At this time , which can be debugged by logging (console.log). It will execute the js file sequentially and does not require an entry method or entry class (different from java).
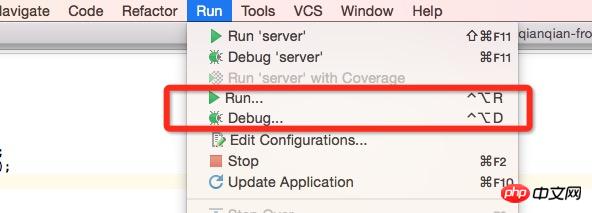
You can configure it next——
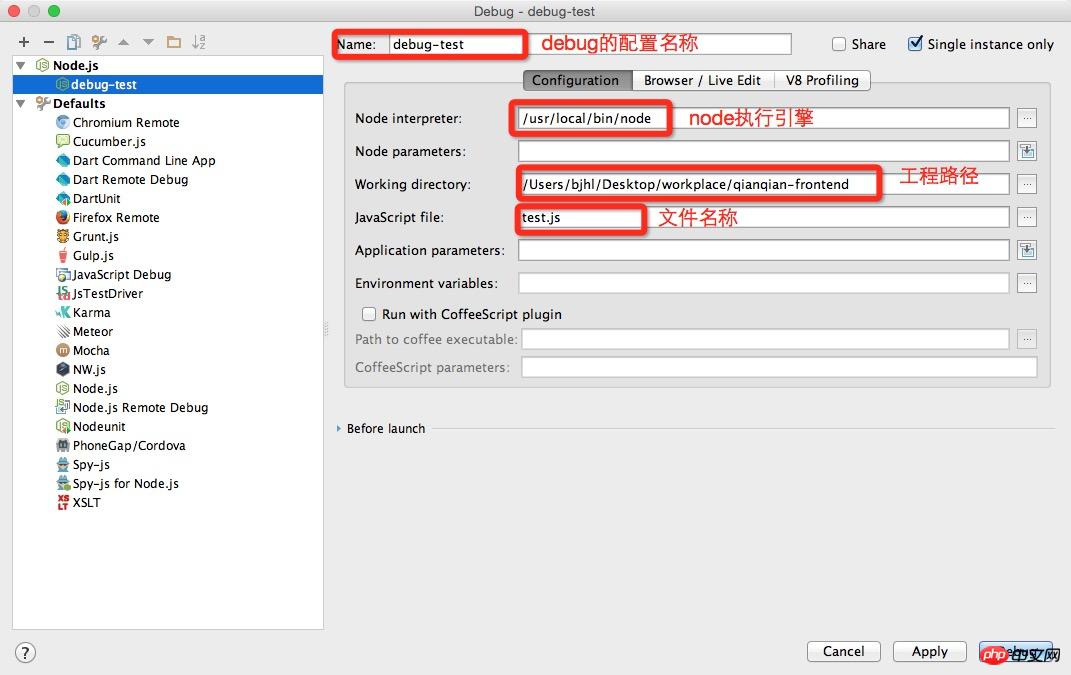
After clicking “Debug”, you will see——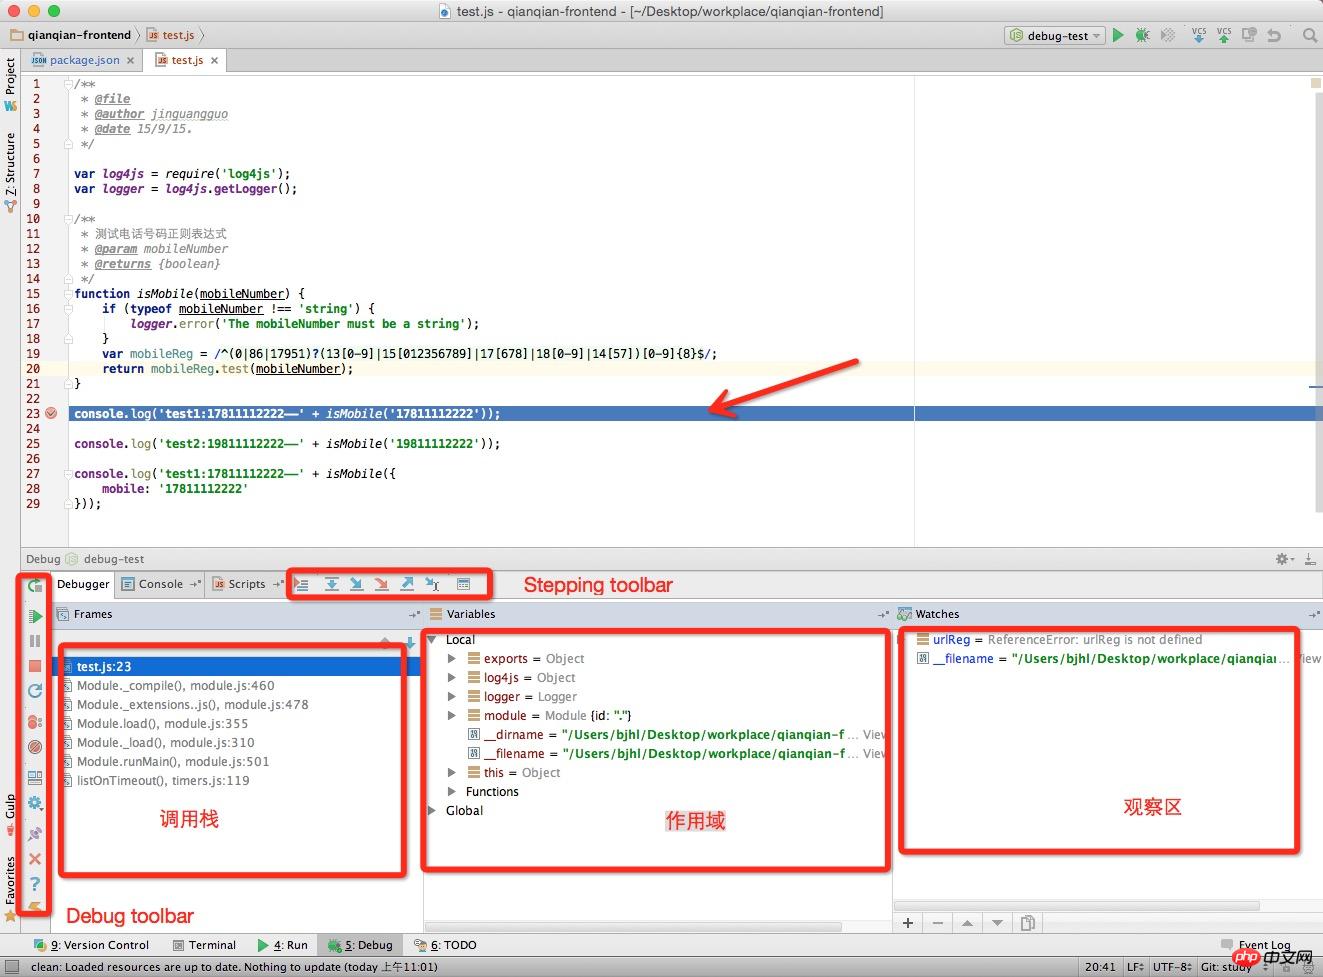
You can see that the code is debugged on line 23. At the same time, in the Debug panel below, you can see the Debug toolbar and Stepping toolbar. As for the description of the two toolbars, just look at the official IntelliJ IDEA description. Attached is the link address: http://www.jetbrains.com/idea /help/debug-tool-window.html
Start debug. A more convenient way is to right-click the file and select debug. Look at the picture below -
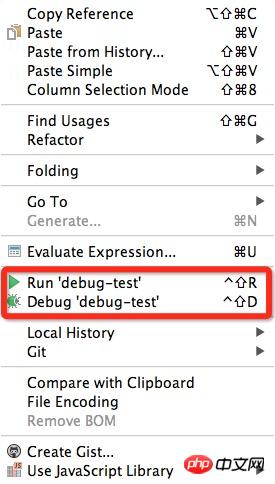
# Above, you can debug simple node program code. The operation is very simple and convenient. Next, let’s take a look at how to debug gulp tasks (grunt is similar, so I won’t list it here).
2. Debugging gulp
Right-click on the corresponding gulpfile.js file, as shown below——
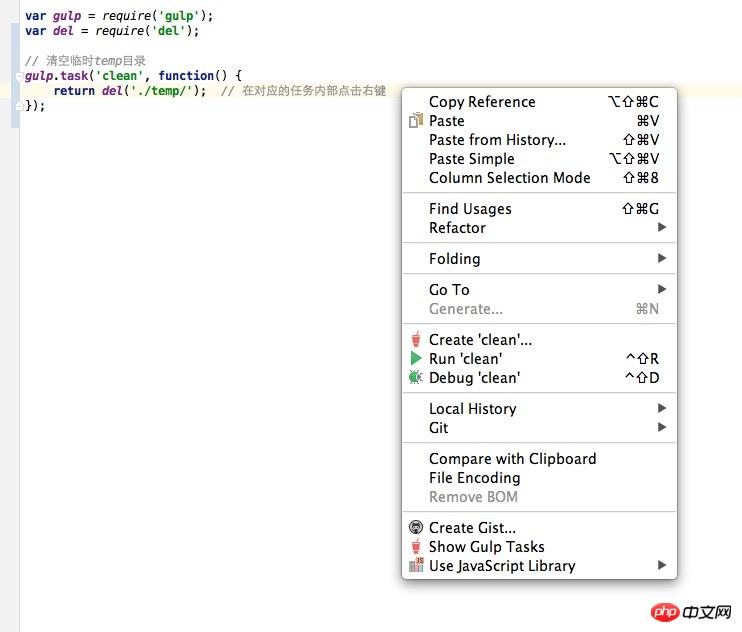
Select "Create 'clean'" to add configuration and start debugging; if you select "Debug 'clean'" you can debug directly.
If your task is not declared in the gulpfile.js file, you can also open the configuration dialog box for configuration, as follows:
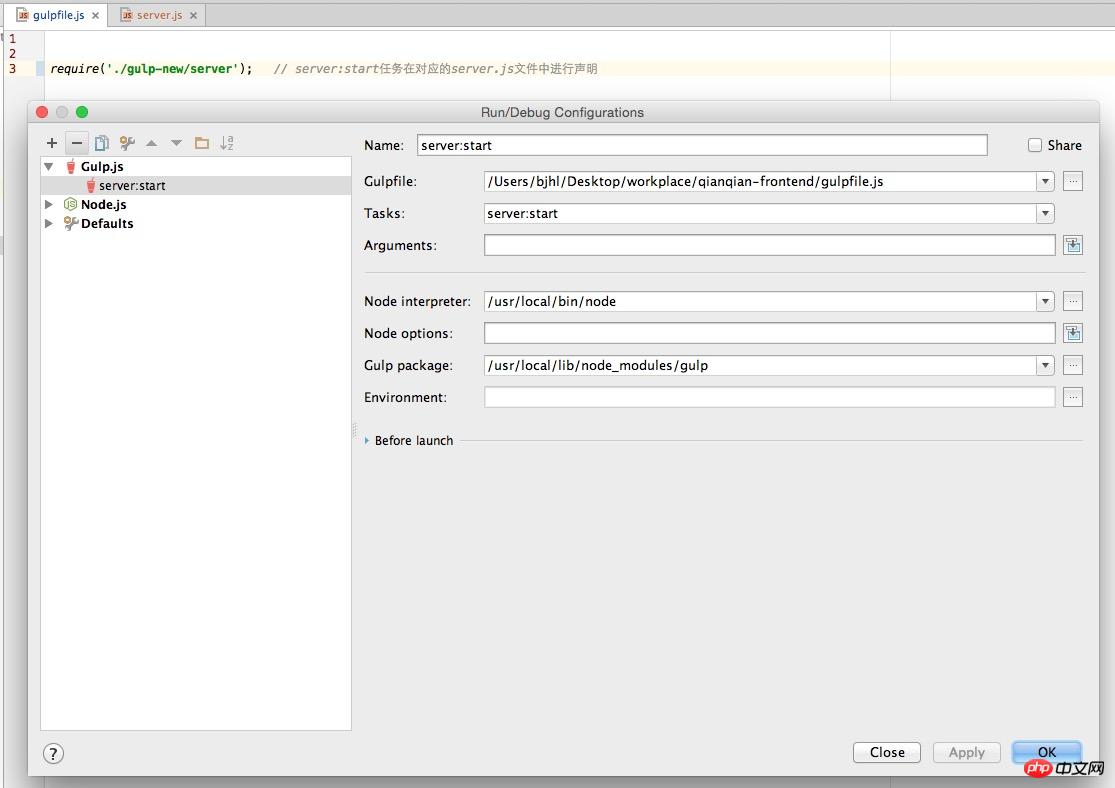
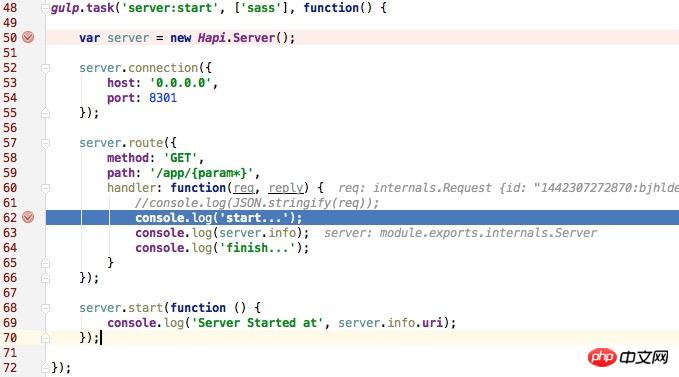
Pay attention to the gulpfile. To operate inside js, it needs to load all task names so that debugging will be effective. You will see the debugging page as follows -
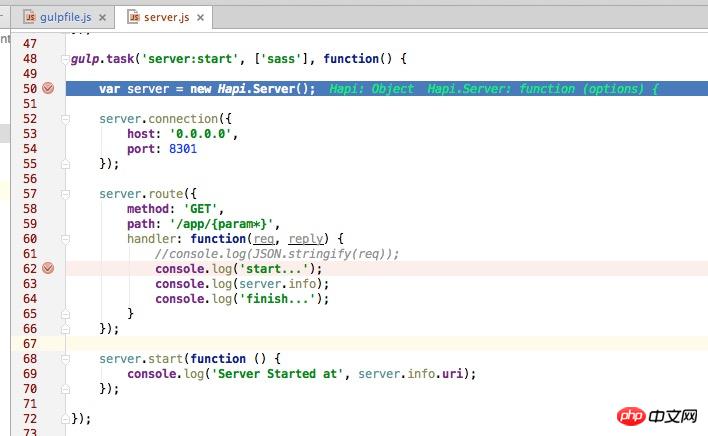
As shown above, we see that the program reaches the breakpoint at line 50. Following the above, we will continue to talk about how to debug web applications.
3. Debugging web applications
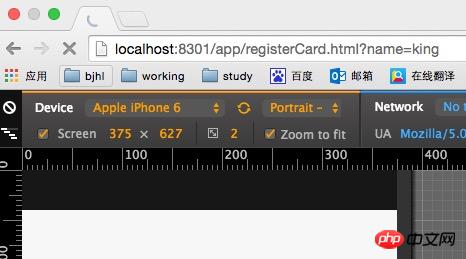
As shown above, we have completed the configuration of breakpoint debugging for gulp tasks (for ordinary non-gulp tasks node program, the same is true), when the web is accessed, it will naturally stop at the corresponding breakpoint, such as -
You can also see that the corresponding browser has always been in Loading status, as shown below——
If you want to view the parameters passed in the request object, such as——
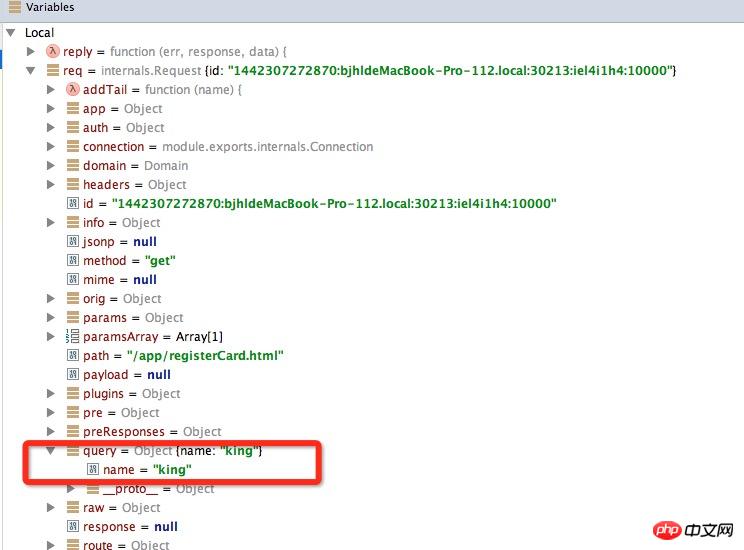
OK, introduction to debugging web applications Come here.
From the perspective of each application category (node normal program debugging, gulp/grunt task debugging, web debugging, etc.), the corresponding debugging configuration and methods are introduced here. Relatively simple and convenient.
The above is the detailed content of Introduction to the method of debugging node programs in webstorm (picture and text). For more information, please follow other related articles on the PHP Chinese website!

Hot AI Tools

Undresser.AI Undress
AI-powered app for creating realistic nude photos

AI Clothes Remover
Online AI tool for removing clothes from photos.

Undress AI Tool
Undress images for free

Clothoff.io
AI clothes remover

AI Hentai Generator
Generate AI Hentai for free.

Hot Article
Hot Tools

Notepad++7.3.1
Easy-to-use and free code editor

SublimeText3 Chinese version
Chinese version, very easy to use

Zend Studio 13.0.1
Powerful PHP integrated development environment

Dreamweaver CS6
Visual web development tools

SublimeText3 Mac version
God-level code editing software (SublimeText3)
Hot Topics
 1386
1386
 52
52

 How to solve webstorm crash
Apr 08, 2024 pm 02:24 PM
How to solve webstorm crash
Apr 08, 2024 pm 02:24 PM
Steps to resolve WebStorm crash issues: Check for updates; Restart your computer; Disable plugins; Reset settings; Clear cache; Check firewall and antivirus software; Reinstall WebStorm; Contact support.
 How to run jsp project in webstorm
Apr 08, 2024 pm 03:39 PM
How to run jsp project in webstorm
Apr 08, 2024 pm 03:39 PM
You can run a JSP project in WebStorm by following these steps: Create a Java Web project. Configure the project and add Web and Java EE facets. Create the JSP file in the "src/main/webapp" directory. Write JSP code including HTML, Java and JSP tags. Deploy and run the project. Access the JSP page by entering the application context root in your browser.
 How to connect to the database in webstorm
Apr 08, 2024 pm 03:42 PM
How to connect to the database in webstorm
Apr 08, 2024 pm 03:42 PM
You can use WebStorm to connect to the database through the following steps: 1. Open the database tool window; 2. Create a data source; 3. Connect to the data source; 4. Query the database; 5. Browse tables and data; 6. Edit database objects; 7. Manage Users and permissions.
 Where is webstorm's automatic line wrapping?
Apr 08, 2024 pm 08:09 PM
Where is webstorm's automatic line wrapping?
Apr 08, 2024 pm 08:09 PM
Automatic line wrapping can be set in WebStorm by following these steps: Check the "Wrap lines" checkbox and set the maximum line width. Select automatic line wrapping rules: None, line wrapping at any position, or line wrapping after keywords. Optional settings: retain manual line wrapping and automatic line wrapping after carriage return. Apply the settings and close the settings window. Note: This setting applies to all file types and can be set individually for specific file types.
 How to restart webstorm
Apr 08, 2024 pm 07:15 PM
How to restart webstorm
Apr 08, 2024 pm 07:15 PM
To restart WebStorm, follow these steps: Use the shortcut keys: Windows/Linux: Ctrl + Shift + A, macOS: Cmd + Shift + A. Enter "restart" in the search field and select "Restart". Using the menu: Click the File menu and select Restart under Reload. Using Task Manager: In Task Manager or Force Quit the application window, select the WebStorm process and click Restart or Restart.
 How to automatically wrap lines in webstorm
Apr 08, 2024 pm 03:48 PM
How to automatically wrap lines in webstorm
Apr 08, 2024 pm 03:48 PM
WebStorm provides automatic line wrapping, which breaks code into separate lines to improve readability. Its rules include: 1. Branch long expressions and statements; 2. Branch method calls; 3. Branch functions and class definitions. User-customizable settings such as maximum line length, indentation type, and shortcut keys. However, word wrapping may not work with single-line comments or string literals and will affect code formatting, so careful review is recommended before application.
 Which one is easier to use, webstorm or vscode?
Apr 08, 2024 pm 07:33 PM
Which one is easier to use, webstorm or vscode?
Apr 08, 2024 pm 07:33 PM
For developers who focus on web development and pursue deep functionality, WebStorm is a better choice; while users who value customizability, lightweightness, and multi-language support are more suitable for VSCode.
 What is the difference between webstorm and idea?
Apr 08, 2024 pm 08:24 PM
What is the difference between webstorm and idea?
Apr 08, 2024 pm 08:24 PM
WebStorm is tailor-made for web development and provides powerful features for web development languages, while IntelliJ IDEA is a versatile IDE that supports multiple languages. Their differences mainly lie in language support, web development features, code navigation, debugging and testing capabilities, and additional features. The final choice depends on language preference and project needs.
