

How to use JVM commands in java to troubleshoot servers

This article will introduce to you how to use JVM commands in java to implement server troubleshooting. It has certain reference value. Friends in need can refer to it. I hope it will be helpful to you.
1. top (Linux command)
Execute the top command: (View the details of process 15477, used below)

System information (first five lines):
Line 1: Top task queue information (system running status and average load), the same as the uptime command result .
Average system load: In the case of a single-core CPU, 0.00 means no load, 1.00 means just full load, more than 1 means overload, the ideal value is 0.7;
Multi-core CPU load: number of CPU cores * ideal value 0.7 = ideal load, for example: 4-core CPU load does not exceed 2.8, which means there is no high load.
Format: up xx days, HH:MM
For example: 241 days, 20:11, means continuous Running for 241 days, 20 hours and 11 minutes
Section 1: System current time, for example: 16:07:37
-
Paragraph 2: System running time, the time before restarting. The longer the time, the more stable the system will be.
Paragraph 3: The number of currently logged in users, for example: 1 user, indicating that there is currently only 1 user logged in
Paragraph 4 Segment: System load, that is, the average length of the task queue. The three values respectively count the average system load in the last 1, 5, and 15 minutes
Line 2: Tasks process related information
Paragraph 1: Total number of processes, for example: Tasks: 231 total, indicating a total of 231 processes running
Paragraph 2: Number of running processes, for example: 1 running,
Paragraph 3: Number of sleeping processes, for example: 230 sleeping,
Paragraph 4: Number of stopped processes, for example: 0 stopped,
Paragraph 5: Number of zombie processes, for example: 0 zombie
Line 3: Cpus CPU related information. If it is a multi-core CPU, press the number 1 to display the CPU information of each core. At this time, line 1 will be converted to the Cpu core number line, and the number 1 can be switched back and forth. .
Paragraph 1:
usPercentage of CPU occupied by user space, for example: Cpu (s): 12.7%us,Paragraph 2:
syThe percentage of CPU occupied by the kernel space, for example: 8.4%sy,Paragraph 3:
niThe percentage of CPU occupied by processes that have changed priorities in the user process space, for example: 0.0%ni,4th Section:
idIdle CPU percentage, for example: 77.1%id,Section 5:
waPercentage of CPU time waiting for input and output, For example: 0.0%wa,Paragraph 6:
hiThe total time spent by the CPU serving hardware interrupts, for example: 0.0%hi,Paragraph 7:
siThe total time spent on CPU service soft interrupt, for example: 1.8%si,- ##Paragraph 8 :
st
Steal time The CPU time stolen by the virtual machine by the hypervisor (if the vm is currently under a hypervisor, the hypervisor actually consumes part of the CPU processing time) - Line 4:
Mem memory related information (Mem: 12196436k total, 12056552k used, 139884k free, 64564k buffers)
- Paragraph 1: Total amount of physical memory, for example: Mem: 12196436k total,
- Paragraph 2: Total amount of physical memory used, for example: 12056552k used,
- Section 3: Total free memory, for example: Mem: 139884k free,
- Section 4: Used as kernel The amount of cached memory, for example: 64564k buffers
- Line 5: Swap swap partition related information (Swap: 2097144k total, 151016k used, 1946128k free, 3120236k cached)
- Paragraph 1: Total amount of swap area, for example: Swap: 2097144k total,
- Paragraph 2: Used Total amount of swap area, for example: 151016k used,
- Section 3: Total amount of free swap area, for example: 1946128k free,
- Segment 4: Total buffered swap area, 3120236k cached
Press in the top command Press f to view the displayed column information, and press the corresponding letter to turn on/off the column. An uppercase letter means on, and a lowercase letter means off. The columns marked with * are the default columns.
- ##A:
PID = (Process Id) Process Id;
E: USER - = (User Name) The user name of the process owner;
H:
PR= (Priority) PriorityI:
NI= (Nice value) nice value. Negative values represent high priority, positive values represent low priorityO:
VIRT= (Virtual Image (kb)) Process usage The total amount of virtual memory, unit kb. VIRT=SWAP RESQ:
RES= (Resident size (kb)) The physical memory used by the process and not swapped out Size, unit kb. RES=CODE DATAT:
SHR= (Shared Mem size (kb)) Shared memory size, unit kbW:
S= (Process Status) Process status. D=uninterruptible sleep state, R=running, S=sleep, T=track/stop, Z=zombie processK:
% CPU= (CPU usage) The percentage of CPU time usage since the last updateN:
%MEM= (Memory usage (RES)) The percentage of physical memory used by the process- ##M:
TIME
= (CPU Time, hundredths ) Total CPU time used by the process, unit 1/100 secondb:
PPID= (Parent Process Pid) Parent Process Idc:
RUSER= (Real user name)d:
UID= (User Id) The user ID of the process ownerf:
GROUP= (Group Name) The group name of the process ownerg:
TTY= (Controlling Tty) The terminal name of the startup process. Processes that are not started from the terminal are displayed as?j:
P= (Last used cpu (SMP)) The last used CPU is only meaningful in a multi-CPU environmentp:
SWAP= (Swapped size (kb)) The size of the virtual memory used by the process that is swapped out, in kbl:
TIME= (CPU Time) The CPU used by the process Total time, in secondsr:
CODE= (Code size (kb)) The physical memory size occupied by the executable code, in kbs:
DATA= ( Data Stack size (kb)) The size of physical memory occupied by parts other than executable code (data segment stack), unit kbu:
nFLT= (Page Fault count) Number of page faultsv:
nDRT= (Dirty Pages count) The number of pages that have been modified since the last time it was writteny:
WCHAN= (Sleeping in Function) If the process is in Sleep, then display the system function name in sleepz:
Flags= (Task Flags <sched.h>) Task flags, refer to sched.h - X:
COMMAND
= (Command name/line) command name/command line
Note: At this time, the PID is the thread id
If there is an exception in thread 15571 and you need to check it, use jstack to print the stack and check the status of thread 15571 (15571 hexadecimal = 3cd3)
 ## 2. jstack
Reference java command--jstack tool
Java command learning series (2)-Jstack
Need to go to the JDK installation directory to use it (you can view the java process through ps x , get the jdk installation directory)
./jstack PID (process id) ./jstack 15477
The red box is thread 15571 (hexadecimal = 3cd3) status
 Analyze jstack log:

Monitor is the main means in Java to achieve mutual exclusion and collaboration between threads. It can be regarded as an object or Class lock.
Every object has only one monitor.
The following figure describes the relationship between the thread and the Monitor, as well as the state transition of the thread:

Owner (The Owner): Indicates that a thread successfully competed for the object lock.
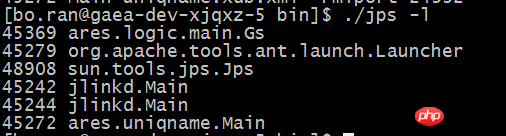
Wait Set: Indicates that the thread releases the object's lock through the object's object.wait() method and waits in the waiting area to be awakened. As can be seen from the figure, a Monitor can only be owned by one thread at a certain moment, and that thread is The thread action waiting in The thread action waiting in (We call the code segment protected by synchronized as the critical section. When a thread applies to enter the critical section, it enters the "Entry Set" queue) NEW: Not started. Will not appear in Dump. RUNNABLE: Executed in the virtual machine, running state. The Owner Area BLOCKED: Blocked and waiting for the monitor lock. Waiting for the lock in the Entry Set area. WATING: Wait indefinitely for another thread to perform a specific operation. In the Wait Set areaWait for a certain condition or monitor to occur, usually staying in statements such as wait(). TIMED_WATING: Time-limited waiting for a specific operation from another thread. In the Wait Set area, the difference between and WAITING is that wait() and other statements add a time limit of wait(timeout). TERMINATED: Exited. locked Target: Use synchronized to apply for object lock successfully, the owner of the monitor. The Owner area. waiting to lock Target: Application for object lock using synchronized failed, Waiting for the lock in the Entry Set area. The thread status is Blocked waiting on Goal: After successfully applying for the object lock using synchronized, release the lock, Wait for the lock in the Wait Set area. The thread status is WAITING or TIMED_WATING parking to wait for Target: park() is called, is in the Wait Set area, waiting for permission. (park is a basic thread blocking primitive that does not block on objects through the monitor. park: Enter the WAITING state, compare wait can make the thread WAITING without acquiring the lock and wake it up through unpark) runnable: The Owner area, status RUNNABLE in Object.wait(): Call wait(), Wait Set area, status is WAITING or TIMED_WAITING, modify waiting on waiting for monitor entry: waiting for lock, Entry Set area, status BLOCKED, modify waiting to lock waiting on condition : Parked due to certain conditions, Wait Set area, status is parking to wait for sleeping: The sleeping thread called Thread.sleep() 1. Check the thread dump. First look at the thread status/thread action (more intuitive) to determine which stage the thread is currently in. Then look at the call modification and lock status, and you can basically determine whether there is a problem with the secondary thread; 2. You can print thread snapshots multiple times in a short period of time (the time period when there may be problems), and then check whether there may be problems This situation of a certain thread can effectively find the problem. Similar to Linux command ps Reference Java command learning series (1) - Jps ./jps ./jps -q ./jps -m ./jps -l ./jps -v [C is a char[] Java Video Tutorial, javaDevelopment Graphic Tutorial, bootstrap Video Tutorial!<span style='font-family: "Microsoft YaHei"'>Active Thread</span> , while other threads are <span style='font-family: "Microsoft YaHei"'>Waiting</span> <span style='font-family: "Microsoft YaHei"'>Thread</span>, respectively in two queues <span style='font-family: "Microsoft YaHei"'>Entry</span> ## Wait inside #Set<span style='font-family: "Microsoft YaHei"'></span> and Wait<span style='font-family: "Microsoft YaHei"'> </span>Set<span style='font-family: "Microsoft YaHei"'></span>. Entry<span style='font-family: "Microsoft YaHei"'> </span>Set<span style='font-family: "Microsoft YaHei"'></span> is Waiting for monitor entry<span style='font-family: "Microsoft YaHei"'>. </span>Wait<span style='font-family: "Microsoft YaHei"'> </span>Set<span style='font-family: "Microsoft YaHei"'></span> is in Object.wait()<span style='font-family: "Microsoft YaHei"'></span>. When a thread applies to enter the critical section, it enters the Entry Set queue. Summary
3. jps


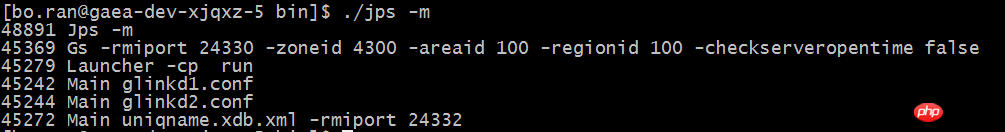

[S is a short[ ]
[I is a int[]
[B is a byte[]
[[I is a int[] []
The above is the detailed content of How to use JVM commands in java to troubleshoot servers. For more information, please follow other related articles on the PHP Chinese website!

Hot AI Tools

Undresser.AI Undress
AI-powered app for creating realistic nude photos

AI Clothes Remover
Online AI tool for removing clothes from photos.

Undress AI Tool
Undress images for free

Clothoff.io
AI clothes remover

Video Face Swap
Swap faces in any video effortlessly with our completely free AI face swap tool!

Hot Article
Hot Tools

Notepad++7.3.1
Easy-to-use and free code editor

SublimeText3 Chinese version
Chinese version, very easy to use

Zend Studio 13.0.1
Powerful PHP integrated development environment

Dreamweaver CS6
Visual web development tools

SublimeText3 Mac version
God-level code editing software (SublimeText3)
Hot Topics
 1386
1386
 52
52

 Using Task Manager in Linux
Aug 15, 2024 am 07:30 AM
Using Task Manager in Linux
Aug 15, 2024 am 07:30 AM
There are many questions that Linux beginners often ask, "Does Linux have a Task Manager?", "How to open the Task Manager on Linux?" Users from Windows know that the Task Manager is very useful. You can open the Task Manager by pressing Ctrl+Alt+Del in Windows. This task manager shows you all the running processes and the memory they consume, and you can select and kill a process from the task manager program. When you first use Linux, you will also look for something that is equivalent to a task manager in Linux. A Linux expert prefers to use the command line to find processes, memory consumption, etc., but you don't have to
 Solve the problem of garbled display of graphs and charts on Zabbix Chinese monitoring server
Jul 31, 2024 pm 02:10 PM
Solve the problem of garbled display of graphs and charts on Zabbix Chinese monitoring server
Jul 31, 2024 pm 02:10 PM
Zabbix's support for Chinese is not very good, but sometimes we still choose Chinese for management purposes. In the web interface monitored by Zabbix, the Chinese under the graphic icon will display small squares. This is incorrect and requires downloading fonts. For example, "Microsoft Yahei", "Microsoft Yahei.ttf" is named "msyh.ttf", upload the downloaded font to /zabbix/fonts/fonts and modify the two characters in the /zabbix/include/defines.inc.php file at define('ZBX_GRAPH_FONT_NAME','DejaVuSans');define('ZBX_FONT_NAME'
 7 ways to help you check the registration date of Linux users
Aug 24, 2024 am 07:31 AM
7 ways to help you check the registration date of Linux users
Aug 24, 2024 am 07:31 AM
Did you know, how to check the creation date of an account on a Linux system? If you know, what can you do? Did you succeed? If yes, how to do it? Basically Linux systems don't track this information, so what are the alternative ways to get this information? You may ask why am I checking this? Yes, there are situations where you may need to review this information and it will be helpful to you at that time. You can use the following 7 methods to verify. Use /var/log/secure Use aureport tool Use .bash_logout Use chage command Use useradd command Use passwd command Use last command Method 1: Use /var/l
 Teach you how to add fonts to Fedora in 5 minutes
Jul 23, 2024 am 09:45 AM
Teach you how to add fonts to Fedora in 5 minutes
Jul 23, 2024 am 09:45 AM
System-wide installation If you install a font system-wide, it will be available to all users. The best way to do this is to use RPM packages from the official software repositories. Before starting, open the "Software" tool in Fedora Workstation, or other tools using the official repository. Select the "Add-ons" category in the selection bar. Then select "Fonts" within the category. You'll see the available fonts similar to the ones in the screenshot below: When you select a font, some details will appear. Depending on several scenarios, you may be able to preview some sample text for the font. Click the "Install" button to add it to your system. Depending on system speed and network bandwidth, this process may take some time to complete
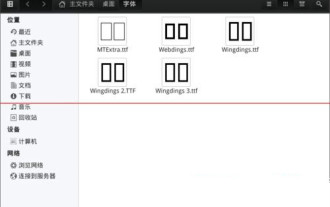 What should I do if the WPS missing fonts under the Linux system causes the file to be garbled?
Jul 31, 2024 am 12:41 AM
What should I do if the WPS missing fonts under the Linux system causes the file to be garbled?
Jul 31, 2024 am 12:41 AM
1. Find the fonts wingdings, wingdings2, wingdings3, Webdings, and MTExtra from the Internet. 2. Enter the main folder, press Ctrl+h (show hidden files), and check if there is a .fonts folder. If not, create one. 3. Copy the downloaded fonts such as wingdings, wingdings2, wingdings3, Webdings, and MTExtra to the .fonts folder in the main folder. Then start wps to see if there is still a "System missing font..." reminder dialog box. If not, just Success! Notes: wingdings, wingdin
 Centos 7 installation and configuration NTP network time synchronization server
Aug 05, 2024 pm 10:35 PM
Centos 7 installation and configuration NTP network time synchronization server
Aug 05, 2024 pm 10:35 PM
Experimental environment: OS: LinuxCentos7.4x86_641. View the current server time zone & list the time zone and set the time zone (if it is already the correct time zone, please skip it): #timedatectl#timedatectllist-timezones#timedatectlset-timezoneAsia/Shanghai2. Understanding of time zone concepts: GMT, UTC, CST, DSTUTC: The entire earth is divided into twenty-four time zones. Each time zone has its own local time. In international radio communication situations, for the sake of unification, a unified time is used, called Universal Coordinated Time (UTC). :UniversalTim
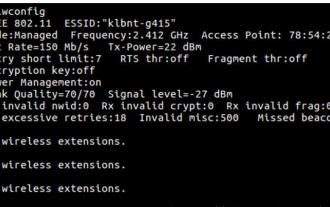 How to connect two Ubuntu hosts to the Internet using one network cable
Aug 07, 2024 pm 01:39 PM
How to connect two Ubuntu hosts to the Internet using one network cable
Aug 07, 2024 pm 01:39 PM
How to use one network cable to connect two ubuntu hosts to the Internet 1. Prepare host A: ubuntu16.04 and host B: ubuntu16.042. Host A has two network cards, one is connected to the external network and the other is connected to host B. Use the iwconfig command to view all network cards on the host. As shown above, the network cards on the author's A host (laptop) are: wlp2s0: This is a wireless network card. enp1s0: Wired network card, the network card connected to host B. The rest has nothing to do with us, no need to care. 3. Configure the static IP of A. Edit the file #vim/etc/network/interfaces to configure a static IP address for interface enp1s0, as shown below (where #==========
 toss! Running DOS on Raspberry Pi
Jul 19, 2024 pm 05:23 PM
toss! Running DOS on Raspberry Pi
Jul 19, 2024 pm 05:23 PM
Different CPU architectures mean that running DOS on the Raspberry Pi is not easy, but it is not much trouble. FreeDOS may be familiar to everyone. It is a complete, free and well-compatible operating system for DOS. It can run some older DOS games or commercial software, and can also develop embedded applications. As long as the program can run on MS-DOS, it can run on FreeDOS. As the initiator and project coordinator of FreeDOS, many users will ask me questions as an insider. The question I get asked most often is: "Can FreeDOS run on a Raspberry Pi?" This question is not surprising. After all, Linux runs very well on the Raspberry Pi
