Summary of the process of connecting Node framework to ELK
The content of this article is a summary of the process of connecting the Node framework to ELK. It has certain reference value. Friends in need can refer to it. I hope it will be helpful to you.
We all have the experience of checking logs on machines. When the number of clusters increases, the inefficiency brought by this primitive operation not only brings great challenges to us in locating existing network problems. , at the same time, we are unable to conduct effective quantitative diagnosis of various indicators of our service framework, let alone targeted optimization and improvement. At this time, it is particularly important to build a real-time log monitoring system with functions such as information search, service diagnosis, and data analysis.
ELK (ELK Stack: ElasticSearch, LogStash, Kibana, Beats) is a mature log solution whose open source and high performance are widely used by major companies. How does the service framework used by our business connect to the ELK system?
Business background
Our business framework background:
The business framework is WebServer based on NodeJs
The service uses the winston log module to localize the logs
The logs generated by the service are stored on the disks of the respective machines
The services are deployed in different regions Multiple machines
Access steps
We will simply summarize the entire framework into ELK into the following steps:
Log structure design: Change the traditional plain text log into a structured object and output it as JSON.
-
Log collection: Output logs at some key nodes in the framework request life cycle
ES index template definition: establishing a mapping from JSON to ES actual storage
1. Log structure design
Traditionally, we When doing log output, the log level (level) and the log content string (message) are directly output. However, we not only pay attention to when and what happened, but we may also need to pay attention to how many times similar logs have occurred, the details and context of the logs, and the associated logs. Therefore, we not only simply structure our logs into objects, but also extract the key fields of the logs.
1. Abstract logs into events
We abstract the occurrence of each log as an event. Events include:
Event metafield
Event occurrence time: datetime, timestamp
Event level: level, for example: ERROR, INFO, WARNING, DEBUG
Event name: event, for example: client-request
The relative time when the event occurs (unit: nanosecond): reqLife, this field is the time (interval) when the event starts to occur relative to the request
The location where the event occurs: line, code location; server, the location of the server
Request meta field
Request unique ID: reqId, this field runs through the entire request All events that occur on the link
Request user ID: reqUid, this field is the user ID, which can track the user's access or request link
Data field
Different types of events require different output details. We put these details (non-meta fields) into d -- data. This makes our event structure clearer and at the same time prevents data fields from contaminating meta fields.
e.g. Such as the client-init event, which will be printed every time the server receives a user request. We classify the user's IP, url and other events as unique data fields and put them into the d object
Give a complete example
{
    "datetime":"2018-11-07 21:38:09.271",
    "timestamp":1541597889271,
    "level":"INFO",
    "event":"client-init",
    "reqId":"rJtT5we6Q",
    "reqLife":5874,
    "reqUid": "999793fc03eda86",
    "d":{
        "url":"/",
        "ip":"9.9.9.9",
        "httpVersion":"1.1",
        "method":"GET",
        "userAgent":"Mozilla/5.0 (Macintosh; Intel Mac OS X 10_14_0) AppleWebKit/537.36 (KHTML, like Gecko) Chrome/70.0.3538.77 Safari/537.36",
        "headers":"*"
    },
    "browser":"{"name":"Chrome","version":"70.0.3538.77","major":"70"}",
    "engine":"{"version":"537.36","name":"WebKit"}",
    "os":"{"name":"Mac OS","version":"10.14.0"}",
    "content":"(Empty)",
    "line":"middlewares/foo.js:14",
    "server":"127.0.0.1"
}Some fields, such as: browser, os, engine Why do we sometimes want the log to be as flat as possible in the outer layer (the maximum depth is 2) to avoid unnecessary ES Performance loss caused by indexing. In actual output, we will output values with a depth greater than 1 as strings. Sometimes some object fields are of concern to us, so we put these special fields in the outer layer to ensure that the output depth is not greater than 2.
Generally, when we print out the log, we only need to pay attention to the event name and data field. In addition, we can uniformly obtain, calculate and output by accessing the context in the method of printing logs.
2. Log transformation output
We mentioned earlier how to define a log event, so how can we upgrade based on the existing log solution while being compatible with the log calling method of the old code.
Upgrade the log of key nodes
// 改造前
logger.info('client-init => ' + JSON.stringfiy({
    url,
    ip,
    browser,
    //...
}));

// 改造后
logger.info({
    event: 'client-init',
    url,
    ip,
    browser,
    //...
});Compatible with the old log calling method
logger.debug('checkLogin');Because winston’s log method itself supports the incoming method of string or object, so for the old When the string is passed in, what the formatter receives is actually { level: 'debug', message: 'checkLogin' }. Formatter is a process of Winston's log format adjustment before log output. This gives us the opportunity to convert the log output by this kind of calling method into a pure output event before log output - we call them raw-log events. No need to modify the calling method.
Transform the log output format
As mentioned earlier, before winston outputs the log, it will go through our predefined formatter, so in addition to the processing of compatible logic, we can put some common logic here. deal with. As for the call, we only focus on the field itself.
Meta field extraction and processing
Field length control
-
Compatible logic processing
How to extract meta fields, this involves the creation and use of context, here is a brief introduction to the creation and use of domain.
//--- middlewares/http-context.js
const domain = require('domain');
const shortid = require('shortid');

module.exports = (req, res, next) => {
    const d = domain.create();
    d.id =  shortid.generate(); // reqId;
    d.req = req;

    //...

    res.on('finish', () => process.nextTick(() => {
        d.id = null;
        d.req = null;
        d.exit();
    });

    d.run(() => next());
}

//--- app.js
app.use(require('./middlewares/http-context.js'));

//--- formatter.js
if (process.domain) {
    reqId = process.domain.id;
}In this way, we can output reqId to all events in a request, thereby achieving the purpose of correlating events.
2. Log collection
Now that we know how to output an event, in the next step, we should consider two questions:
We Where should the event be output?
What details should be output for the event?
In other words, in the entire request link, which nodes are we concerned about? If a problem occurs, which node's information can be used to quickly locate the problem? In addition, which node data can we use for statistical analysis?
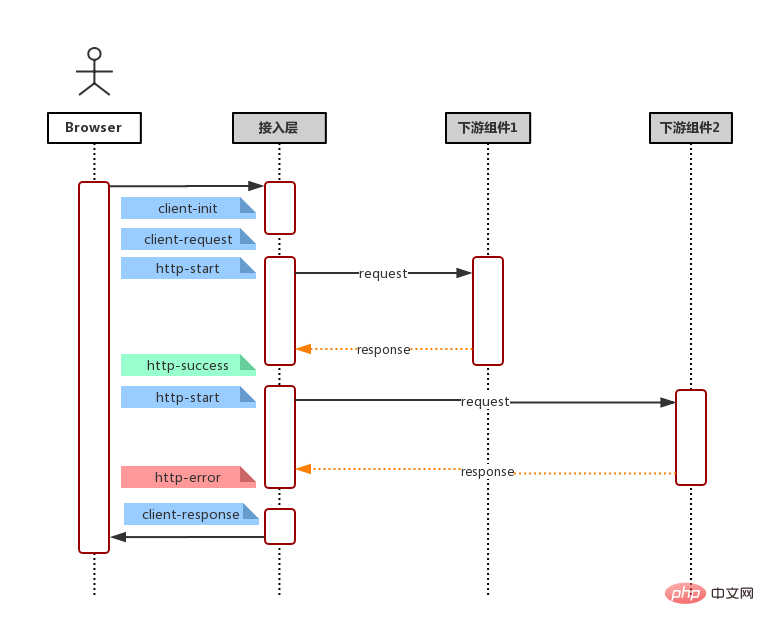
Combined with common request links (user request, service side receiving request, service request to downstream server/database (*multiple times), data aggregation rendering, service response), as shown in the flow chart below

Then, we can define our event like this:
User request
client-init: Print when the frame receives the request ( Unparsed), including: request address, request headers, HTTP version and method, user IP and browser
client-request: Printed in the frame when the request is received (parsed), including: request address, request headers , Cookie, request package body
client-response: Print the request returned by the frame, including: request address, response code, response header, response package body
下游依赖
http-start: 打印于请求下游起始:请求地址,请求包体,模块别名(方便基于名字聚合而且域名)
http-success: 打印于请求返回 200:请求地址,请求包体,响应包体(code & msg & data),耗时
http-error: 打印于请求返回非 200,亦即连接服务器失败:请求地址,请求包体,响应包体(code & message & stack),耗时。
http-timeout: 打印于请求连接超时:请求地址,请求包体,响应包体(code & msg & stack),耗时。
字段这么多,该怎么选择? 一言以蔽之,事件输出的字段原则就是:输出你关注的,方便检索的,方便后期聚合的字段。一些建议
请求下游的请求体和返回体有固定格式, e.g. 输入:{ action: 'getUserInfo', payload: {} } 输出: { code: 0, msg: '', data: {}} 我们可以在事件输出 action,code 等,以便后期通过 action 检索某模块具体某个接口的各项指标和聚合。
一些原则
保证输出字段类型一致 由于所有事件都存储在同一个 ES 索引, 因此,相同字段不管是相同事件还是不同事件,都应该保持一致,例如:code不应该既是数字,又是字符串,这样可能会产生字段冲突,导致某些记录(document)无法被冲突字段检索到。
ES 存储类型为 keyword, 不应该超过 ES mapping 设定的 ignore_above 中指定的字节数(默认4096个字节)。否则同样可能会产生无法被检索的情况
三、ES 索引模版定义
这里引入 ES 的两个概念,映射(Mapping)与模版(Template)。
首先,ES 基本的存储类型大概枚举下,有以下几种
String: keyword & text
Numeric: long, integer, double
Date: date
Boolean: boolean
一般的,我们不需要显示指定每个事件字段的在ES对应的存储类型,ES 会自动根据字段第一次出现的document中的值来决定这个字段在这个索引中的存储类型。但有时候,我们需要显示指定某些字段的存储类型,这个时候我们需要定义这个索引的 Mapping, 来告诉 ES 这此字段如何存储以及如何索引。
e.g.
还记得事件元字段中有一个字段为 timestamp ?实际上,我们输出的时候,timestamp 的值是一个数字,它表示跟距离 1970/01/01 00:00:00 的毫秒数,而我们期望它在ES的存储类型为 date 类型方便后期的检索和可视化, 那么我们创建索引的时候,指定我们的Mapping。
PUT my_logs
{
  "mappings": {
    "_doc": {
      "properties": {
        "title":    {
            "type": "date",
            "format": "epoch_millis"
         },
      }
    }
  }
}但一般的,我们可能会按日期自动生成我们的日志索引,假定我们的索引名称格式为 my_logs_yyyyMMdd (e.g. my_logs_20181030)。那么我们需要定义一个模板(Template),这个模板会在(匹配的)索引创建时自动应用预设好的 Mapping。
PUT _template/my_logs_template
{
  "index_patterns": "my_logs*",
  "mappings": {
    "_doc": {
      "properties": {
        "title":    {
            "type": "date",
            "format": "epoch_millis"
         },
      }
    }
  }
}小结
至此,日志改造及接入的准备工作都已经完成了,我们只须在机器上安装 FileBeat -- 一个轻量级的文件日志Agent, 它负责将日志文件中的日志传输到 ELK。接下来,我们便可使用 Kibana 快速的检索我们的日志。
The above is the detailed content of Summary of the process of connecting Node framework to ELK. For more information, please follow other related articles on the PHP Chinese website!

Hot AI Tools

Undresser.AI Undress
AI-powered app for creating realistic nude photos

AI Clothes Remover
Online AI tool for removing clothes from photos.

Undress AI Tool
Undress images for free

Clothoff.io
AI clothes remover

AI Hentai Generator
Generate AI Hentai for free.

Hot Article

Hot Tools

Notepad++7.3.1
Easy-to-use and free code editor

SublimeText3 Chinese version
Chinese version, very easy to use

Zend Studio 13.0.1
Powerful PHP integrated development environment

Dreamweaver CS6
Visual web development tools

SublimeText3 Mac version
God-level code editing software (SublimeText3)

Hot Topics
 1376
1376
 52
52
 PHP and Vue: a perfect pairing of front-end development tools
Mar 16, 2024 pm 12:09 PM
PHP and Vue: a perfect pairing of front-end development tools. In today's era of rapid development of the Internet, front-end development has become increasingly important. As users have higher and higher requirements for the experience of websites and applications, front-end developers need to use more efficient and flexible tools to create responsive and interactive interfaces. As two important technologies in the field of front-end development, PHP and Vue.js can be regarded as perfect tools when paired together. This article will explore the combination of PHP and Vue, as well as detailed code examples to help readers better understand and apply these two
 How to use Go language for front-end development?
Jun 10, 2023 pm 05:00 PM
With the development of Internet technology, front-end development has become increasingly important. Especially the popularity of mobile devices requires front-end development technology that is efficient, stable, safe and easy to maintain. As a rapidly developing programming language, Go language has been used by more and more developers. So, is it feasible to use Go language for front-end development? Next, this article will explain in detail how to use Go language for front-end development. Let’s first take a look at why Go language is used for front-end development. Many people think that Go language is a
 Questions frequently asked by front-end interviewers
Mar 19, 2024 pm 02:24 PM
In front-end development interviews, common questions cover a wide range of topics, including HTML/CSS basics, JavaScript basics, frameworks and libraries, project experience, algorithms and data structures, performance optimization, cross-domain requests, front-end engineering, design patterns, and new technologies and trends. . Interviewer questions are designed to assess the candidate's technical skills, project experience, and understanding of industry trends. Therefore, candidates should be fully prepared in these areas to demonstrate their abilities and expertise.
 Is Django front-end or back-end? check it out!
Jan 19, 2024 am 08:37 AM
Django is a web application framework written in Python that emphasizes rapid development and clean methods. Although Django is a web framework, to answer the question whether Django is a front-end or a back-end, you need to have a deep understanding of the concepts of front-end and back-end. The front end refers to the interface that users directly interact with, and the back end refers to server-side programs. They interact with data through the HTTP protocol. When the front-end and back-end are separated, the front-end and back-end programs can be developed independently to implement business logic and interactive effects respectively, and data exchange.
 Can golang be used as front-end?
Jun 06, 2023 am 09:19 AM
Golang can be used as a front-end. Golang is a very versatile programming language that can be used to develop different types of applications, including front-end applications. By using Golang to write the front-end, you can get rid of a series of problems caused by languages such as JavaScript. For example, problems such as poor type safety, low performance, and difficult to maintain code.
 C# development experience sharing: front-end and back-end collaborative development skills
Nov 23, 2023 am 10:13 AM
As a C# developer, our development work usually includes front-end and back-end development. As technology develops and the complexity of projects increases, the collaborative development of front-end and back-end has become more and more important and complex. This article will share some front-end and back-end collaborative development techniques to help C# developers complete development work more efficiently. After determining the interface specifications, collaborative development of the front-end and back-end is inseparable from the interaction of API interfaces. To ensure the smooth progress of front-end and back-end collaborative development, the most important thing is to define good interface specifications. Interface specification involves the name of the interface
 Exploring Go language front-end technology: a new vision for front-end development
Mar 28, 2024 pm 01:06 PM
As a fast and efficient programming language, Go language is widely popular in the field of back-end development. However, few people associate Go language with front-end development. In fact, using Go language for front-end development can not only improve efficiency, but also bring new horizons to developers. This article will explore the possibility of using the Go language for front-end development and provide specific code examples to help readers better understand this area. In traditional front-end development, JavaScript, HTML, and CSS are often used to build user interfaces
 How to implement instant messaging on the front end
Oct 09, 2023 pm 02:47 PM
Methods for implementing instant messaging include WebSocket, Long Polling, Server-Sent Events, WebRTC, etc. Detailed introduction: 1. WebSocket, which can establish a persistent connection between the client and the server to achieve real-time two-way communication. The front end can use the WebSocket API to create a WebSocket connection and achieve instant messaging by sending and receiving messages; 2. Long Polling, a technology that simulates real-time communication, etc.


